|
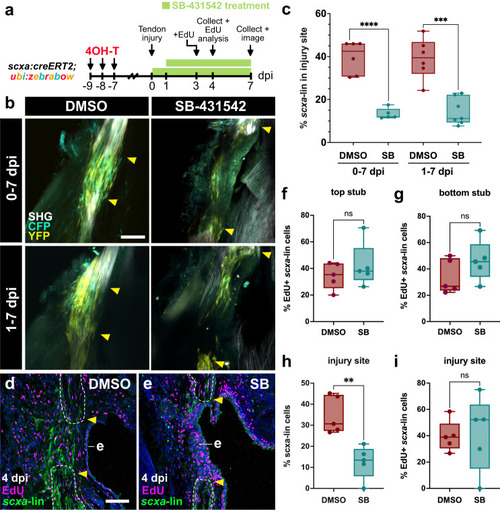
TGF-β signaling is required for tenocyte recruitment, but not proliferation, during bridge formation. a Experimental schematic of combined tenocyte lineage tracing with SB-431542 treatment and subsequent analyses performed. EdU analysis was only performed on the 1-4 dpi treatment regimen. b 2-photon stacks of CFP+ and/or YFP+ labeled lineage-traced tenocytes in regenerating tendons at 7 days post-injury (dpi) for both 0-7 dpi and 1-7 dpi DMSO/SB-431542 (SB) treatments. Yellow arrowheads denote severed tendon ends. Scale bar, 100 µm. c Quantification of the percentage of scxa-lineage cells in the injury site at 7 dpi for both 0-7 dpi and 1-7 dpi DMSO/SB-431542 (SB) treatments. Unpaired two-tailed t-tests were performed between DMSO controls and their respective SB-431542 counterparts for statistical analysis (0-7 dpi: DMSO, N = 6; SB, N = 5; 1-7 dpi: DMSO, N = 6; SB, N = 7). ****p < 0.0001, ***p < 0.001. d, e Representative confocal images of EdU-stained DMSO and SB-431542 (SB)-treated regenerating tendons at 4 dpi following a 1-4 dpi treatment regimen. EdU staining is shown in magenta and anti-GFP immunofluorescence detection of scxa-lineage cells is shown in green. Severed tendon stubs are outlined in white dotted lines and the tendon ends are denoted by yellow arrowheads. (e), epidermis. f–g Quantification of the percentage of proliferating EdU+ scxa-lineage tenocytes in the top (f) and bottom (g) tendon ends at 4 dpi after a 1-4 dpi DMSO or SB-431542 treatment. Unpaired two-tailed t-tests were performed between DMSO and SB-431542 treatment conditions. ns, not significant. h, i Quantification of the percentage of scxa-lineage cells (h) and the percentage of proliferating EdU+ scxa-lineage tenocytes (i) in the injury site at 4 dpi following a 1-4 dpi SB-431542 treatment regimen. Unpaired two-tailed t-tests were performed between DMSO and SB-431542 treatment conditions. **p < 0.01; ns not significant. Box and whiskers plots in panels (c) and (f–i) show whiskers extending from the minimum to maximum values, a line at the median, and a box encompassing the 25th to 75th percentiles.
|