|
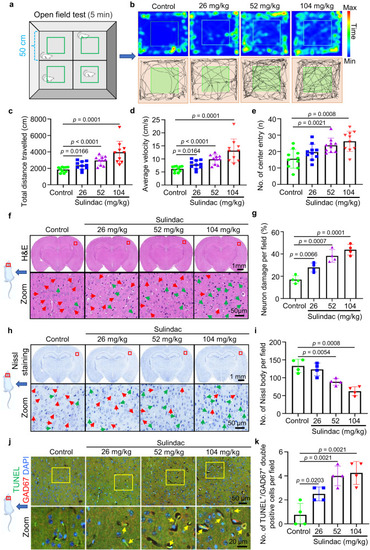
Sulindac caused mice to display hyperactivity and induced apoptosis of neocortical GABAergic neurons. a Schematic diagram of the monitoring the locomotion of mice in an open field. b–e Hyperlocomotion of mice was manifested as increases in movement distance, average speed and the number of entries into the central area after sulindac treatment. The data are presented as the means ± SDs (n = 10 mice per group). Statistics calculated by unpaired two-tailed Student’s t test. Source data are provided as a Source Data file. f Haematoxylin/eosin (H & E) staining showed the structural morphology of neuronal cells in the cerebral cortex of mice after sulindac treatment. Red arrows indicate normal neuronal cells, and green arrows indicate dying neurons. g Quantification of dying neurons in the cerebral cortex in mice. The data are presented as the means ± SDs (n = 4 mice per group). Statistics calculated by unpaired two-tailed Student’s t test. Source data are provided as a Source Data file. h Nissl staining demonstrated that the Nissl bodies of neurons were gradually lost in the cerebral cortex in mice in a dose-dependent manner after sulindac treatment. Normal neurons contained a large number of Nissl bodies (red arrow), which disappeared in dying neurons (green arrow). i Quantification of Nissl bodies in the cerebral cortex in mice. The data are presented as the means ± SDs (n = 4 mice per group). Statistics calculated by unpaired two-tailed Student’s t test. Source data are provided as a Source Data file. j Double staining of TUNEL/GAD67 in the cerebral cortex in mice. The yellow arrow indicates TUNEL/GAD67 double-positive cells. k Quantification of the number of TUNEL/GAD67 double-positive cells in the cerebral cortex in mice. The data are presented as the means ± SDs (n = 4 mice per group). Each dot in (c–e,g,i, k) denotes one mouse. Statistics calculated by unpaired two-tailed Student’s t test. Source data are provided as a Source Data file.
|