|
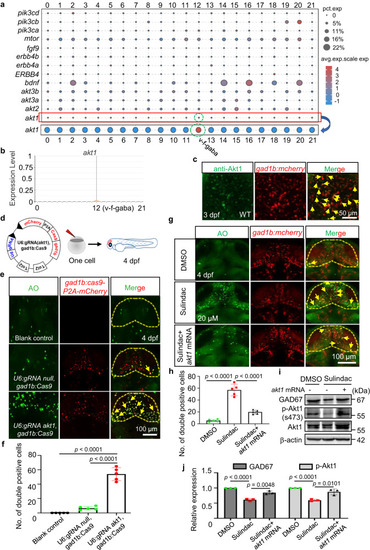
Sulindac selectively induced apoptosis of GABAergic neurons via Akt signalling in zebrafish. a Gene dot plot showing that only Akt1 was abundant in GABAergic neurons, but not akt2, akt3a, akt3b, bdnf, erbb4 (erbb4a, erbb4b, ERBB4), fgf9, mtor, or pi3k (pi3ca, pi3cb, pi3cd). b Gene violin map distribution showed that akt1 was distributed mainly in the subpopulation of GABAergic neurons. c Double immunostaining revealed that Akt1 proteins were selectively expressed in GABAergic neurons in the midbrains of Tg(gad1b:mCherry) embryos, as indicated by yellow arrows. The experiment was repeated twice with similar results, and at least five zebrafish were observed each time. d Flow diagram showing a tissue-specific CRISPR vector microinjected to knoc kout akt1 in GABAergic neurons. e Specific knock out of akt1 in GABAergic neurons via injection with the gad1b:Cas9-T2A-mCherry,U6:gRNA akt1 vector led to apoptosis of GABAergic neurons, as indicated by yellow arrows. f Quantification of the yellow colour double-positive cells in the midbrains of embryos. The values represent the means ± SDs (n = 5 larvae for per group, each dot denotes one larva). Statistics calculated by unpaired two-tailed Student’s t test. Source data are provided as a Source Data file. g The number of apoptotic GABAergic neurons was restored by overexpression of akt1 mRNA after sulindac treatment, as indicated by yellow arrows. h Quantification of the yellow double-positive cells in the midbrains of embryos. The values represent the means ± SDs (n = 5 larvae for per group, each dot denotes one larva). Statistics calculated by unpaired two-tailed Student’s t test. Source data are provided as a Source Data file. Apoptosis of GABAergic neurons in the midbrain is indicated by yellow arrows. (i) Western blot analysis showed that overexpression of akt1 inhibited the declines in p-Akt1 and Gad67 protein levels. j The data are presented as the means ± SDs (n = 3 independent biological replicates). Statistics calculated by unpaired two-tailed Student’s t test. Source data are provided as a Source Data file. β-Actin was used as an internal control.
|