FIGURE SUMMARY
Title

Sulindac selectively induces autophagic apoptosis of GABAergic neurons and alters motor behaviour in zebrafish

Authors
Sun, W., Wang, M., Zhao, J., Zhao, S., Zhu, W., Wu, X., Li, F., Liu, W., Wang, Z., Gao, M., Zhang, Y., Xu, J., Zhang, M., Wang, Q., Wen, Z., Shen, J., Zhang, W., Huang, Z.
Source
Full text @ Nat. Commun.

Sulindac, identified through a small clinical anti-inflammatory drug screening, elicited neurodevelopmental toxicity.

a Flow diagram of a small-scale anti-inflammatory drug screening for brain developmental toxicity. Wild-type (WT) embryos were collected and arrayed in 24-well plates at 2 dpf. Each well contained the compound dissolved to 10 μM in DMSO and E3 embryo medium. Screening was conducted via acridine orange (AO) staining at 4 dpf. bi Representative results of AO staining. Among the 46 anti-inflammatory drugs, only sulindac (c) induced apoptosis in the zebrafish midbrain (dashed line), while the other drugs, such as acetaminophen (d), aspirin (e), ibuprofen (f), naproxen (g), rofecoxib (h) and diclofenac (i), had no significant toxic effects compared to the DMSO (b). The experiments were independently repeated twice with similar results, and at least six zebrafish were observed each time. j AO+ cells (green signals) were colocalized with neuronal cells (red signals) in the midbrains of Tg(Xla.Tubb:DsRedx) embryos indicated by yellow arrows. k Quantification of the yellow double-positive cells in the midbrain. The values represent the means ± SDs (n = 4 larvae for per group, each dot denotes one larva). Statistics calculated by unpaired two-tailed Student’s t test. Source data are provided as a Source Data file.

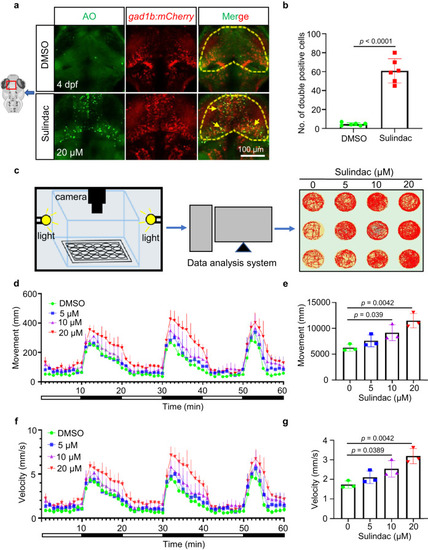
Sulindac selectively induced apoptosis of GABAergic neurons and altered motor behaviour in zebrafish larvae.

a Most of the AO+ cells (green signals) were colocalized with mCherry+ GABAergic neurons (red signals) in the midbrains of Tg(gad1b:mCherry) embryos after sulindac treatment indicated by yellow arrows. b Quantification of the double-positive cells (yellow signals) in the midbrains of embryos. The values represent the means ± SDs (n = 6 larvae for per group, each dot denotes one larva). Statistics calculated by unpaired two-tailed Student’s t test. Source data are provided as a Source Data file. Apoptosis of GABAergic neurons in the midbrain is indicated by yellow arrows. c A system of behavioural experiments for recording larval motion trials in 60 min, and three representative photographs are shown for each group. d, f Swimming distance and velocity behavioural data were binned into 1-min intervals for analysis. The total movement (e) and average velocity (g) of zebrafish larvae exposed to sulindac at 5 dpf were examined during the light–dark photoperiod stimulation test (60 min). All data are presented as the means ± SDs (n = 3 independent biological replicates, eight larvae per replicate). Statistics calculated by unpaired two-tailed Student’s t test. Source data are provided as a Source Data file.

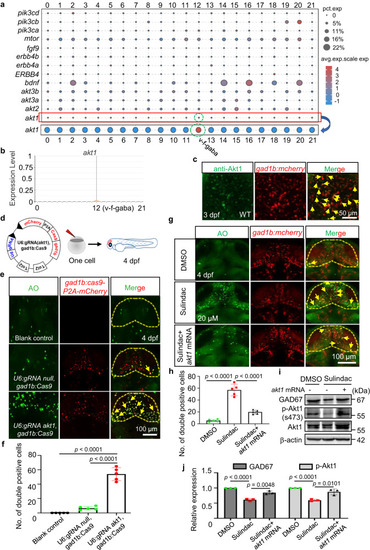
Sulindac selectively induced apoptosis of GABAergic neurons via Akt signalling in zebrafish.

a Gene dot plot showing that only Akt1 was abundant in GABAergic neurons, but not akt2, akt3a, akt3b, bdnf, erbb4 (erbb4a, erbb4b, ERBB4), fgf9, mtor, or pi3k (pi3ca, pi3cb, pi3cd). b Gene violin map distribution showed that akt1 was distributed mainly in the subpopulation of GABAergic neurons. c Double immunostaining revealed that Akt1 proteins were selectively expressed in GABAergic neurons in the midbrains of Tg(gad1b:mCherry) embryos, as indicated by yellow arrows. The experiment was repeated twice with similar results, and at least five zebrafish were observed each time. d Flow diagram showing a tissue-specific CRISPR vector microinjected to knoc kout akt1 in GABAergic neurons. e Specific knock out of akt1 in GABAergic neurons via injection with the gad1b:Cas9-T2A-mCherry,U6:gRNA akt1 vector led to apoptosis of GABAergic neurons, as indicated by yellow arrows. f Quantification of the yellow colour double-positive cells in the midbrains of embryos. The values represent the means ± SDs (n = 5 larvae for per group, each dot denotes one larva). Statistics calculated by unpaired two-tailed Student’s t test. Source data are provided as a Source Data file. g The number of apoptotic GABAergic neurons was restored by overexpression of akt1 mRNA after sulindac treatment, as indicated by yellow arrows. h Quantification of the yellow double-positive cells in the midbrains of embryos. The values represent the means ± SDs (n = 5 larvae for per group, each dot denotes one larva). Statistics calculated by unpaired two-tailed Student’s t test. Source data are provided as a Source Data file. Apoptosis of GABAergic neurons in the midbrain is indicated by yellow arrows. (i) Western blot analysis showed that overexpression of akt1 inhibited the declines in p-Akt1 and Gad67 protein levels. j The data are presented as the means ± SDs (n = 3 independent biological replicates). Statistics calculated by unpaired two-tailed Student’s t test. Source data are provided as a Source Data file. β-Actin was used as an internal control.

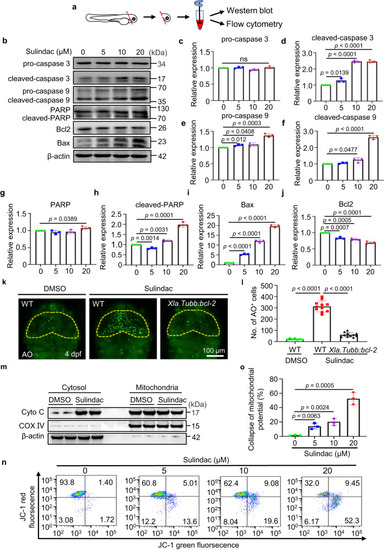
Sulindac induces apoptosis via the mitochondrial pathway.

a Schematic diagram showing that the head tissue of embryos was split for Western blotting and flow cytometry. b Western blot analysis of the protein levels of apoptosis-related proteins with sulindac treatment at increasing concentrations. The immunoblot intensity was determined by ImageJ analysis software. cj The data are presented as the means ± SDs (n = 3 independent biological replicates). NS, not significant. Statistics calculated by unpaired two-tailed Student’s t test. Source data are provided as a Source Data file. β-Actin was used as an internal control. k After treatment with sulindac or DMSO, the number of apoptotic neurons (AO + ) decreased significantly after overexpression of bcl2 in the midbrains of Tg(Xla.Tubb:bcl-2) embryos. l Quantification of AO+ cells in the midbrain. n = 7, 11 and 11 for the DMSO (WT) group, sulindac (WT) group, and sulindac (Xla.Tubb:bcl-2) group, respectively. Each dot in (l) denotes one larva. The values represent the means ± SDs. Statistics calculated by unpaired two-tailed Student’s t test. Source data are provided as a Source Data file. m Western blot analysis of the protein levels of cytochrome c in the cytosolic and mitochondrial fractions of zebrafish larval neurons. The experiment was repeated three times independently with similar results. n Flow cytometric analysis of mitochondrial transmembrane potential (ΔΨm) after staining with JC-1. Zebrafish neuronal cells were treated with increasing concentrations of sulindac. o Quantitative data of sulindac-induced collapse of mitochondrial potential. Each column represents the mean ± SDs (n = 3 independent biological replicates). Statistics calculated by unpaired two-tailed Student’s t test. Source data are provided as a Source Data file.

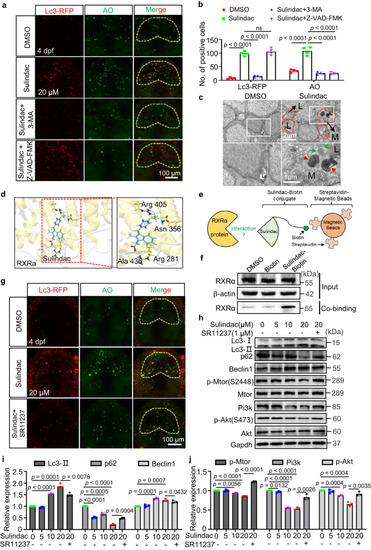
Sulindac promoted RXRa-dependent autophagy-induced apoptosis through the PI3K/AKT/mTOR pathway in zebrafish neurons.

a Autophagy and apoptosis were evaluated according to Lc3-RFP and AO signals when treated with 3-MA (autophagy inhibitors) or Z-VAD-FMK (apoptosis inhibitors) before sulindac treatment. b Quantification of Lc3-RFP+ and AO+ cells in the midbrain of embryos. The values represent the means ± SDs (n = 4 larvae for per group, each dot denotes one larva). NS, not significant. Statistics calculated by unpaired two-tailed Student’s t test. c Transmission electron micrograph analysis of autophagy measured in the midbrains of embryos treated with sulindac or DMSO. Small autophagosomes (green arrows) and autolysosomes (dashed lines) contained degraded cellular debris (red arrows), lysosomes (L), and mitochondria (M). The experiment was repeated once with similar results, and three zebrafish were observed in each group. d A docking study was performed to evaluate the interaction of RXRa (PDB ID: Q90416) with sulindac (Zinc ID: 3786192) via the SwissDock server (http://www.swissdock.ch/). The most favourable binding mode showed four hydrogen bonds and had a full fitness of −2523.73 kcal/mol with −7.56 kcal/mol docked free energy; the close-up view is represented in the right panel. e Schematic diagram of the use of the streptavidin–biotin (SA–biotin) system to acquire proteins bound to sulindac. f Western blot analysis showed that there was an interaction between sulindac and RXRa protein in zebrafish head tissue. The experiment was repeated three times independently with similar results. g Autophagy and apoptosis were evaluated according to Lc3-RFP and AO signals upon treatment with SR11237 before sulindac treatment. The experiment was repeated twice with similar results, and at least five zebrafish were observed each time. h Western blot revealed the expression levels of autophagy-associated proteins and the PI3K/AKT/mTOR pathway proteins after treatment with increasing concentrations of sulindac as indicated. The immunoblot intensity was determined by ImageJ analysis software i, j The data are presented as the means ± SDs (n = 3 independent biological replicates). Statistics calculated by unpaired two-tailed Student’s t test. Source data are provided as a Source Data file. GAPDH was used as an internal control.

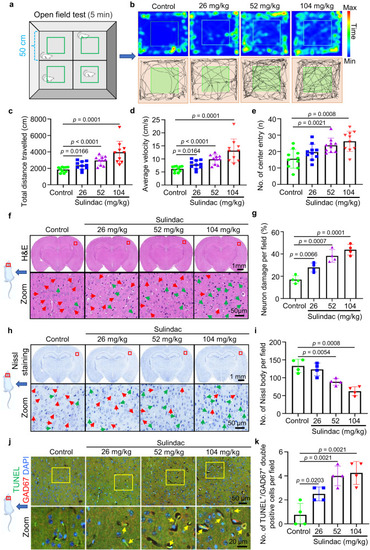
Sulindac caused mice to display hyperactivity and induced apoptosis of neocortical GABAergic neurons.

a Schematic diagram of the monitoring the locomotion of mice in an open field. b–e Hyperlocomotion of mice was manifested as increases in movement distance, average speed and the number of entries into the central area after sulindac treatment. The data are presented as the means ± SDs (n = 10 mice per group). Statistics calculated by unpaired two-tailed Student’s t test. Source data are provided as a Source Data file. f Haematoxylin/eosin (H & E) staining showed the structural morphology of neuronal cells in the cerebral cortex of mice after sulindac treatment. Red arrows indicate normal neuronal cells, and green arrows indicate dying neurons. g Quantification of dying neurons in the cerebral cortex in mice. The data are presented as the means ± SDs (n = 4 mice per group). Statistics calculated by unpaired two-tailed Student’s t test. Source data are provided as a Source Data file. h Nissl staining demonstrated that the Nissl bodies of neurons were gradually lost in the cerebral cortex in mice in a dose-dependent manner after sulindac treatment. Normal neurons contained a large number of Nissl bodies (red arrow), which disappeared in dying neurons (green arrow). i Quantification of Nissl bodies in the cerebral cortex in mice. The data are presented as the means ± SDs (n = 4 mice per group). Statistics calculated by unpaired two-tailed Student’s t test. Source data are provided as a Source Data file. j Double staining of TUNEL/GAD67 in the cerebral cortex in mice. The yellow arrow indicates TUNEL/GAD67 double-positive cells. k Quantification of the number of TUNEL/GAD67 double-positive cells in the cerebral cortex in mice. The data are presented as the means ± SDs (n = 4 mice per group). Each dot in (ce,g,i, k) denotes one mouse. Statistics calculated by unpaired two-tailed Student’s t test. Source data are provided as a Source Data file.

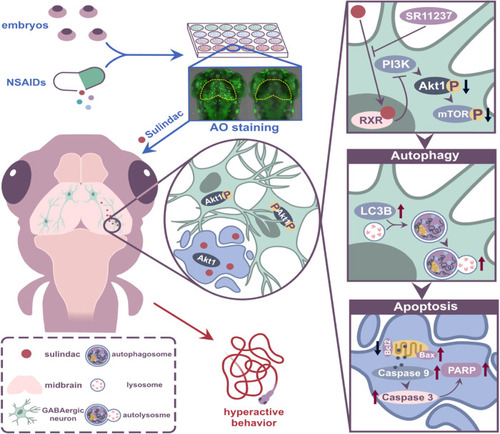
Schematic illustration of the proposed mechanisms.

Sulindac treatment induces RXRa-dependent autophagic cell death in GABAergic neurons via the PI3K/AKT/mTOR pathway, leading to hyperactive behaviour in zebrafish larvae.

Acknowledgments
This image is the copyrighted work of the attributed author or publisher, and ZFIN has permission only to display this image to its users. Additional permissions should be obtained from the applicable author or publisher of the image. Full text @ Nat. Commun.