|
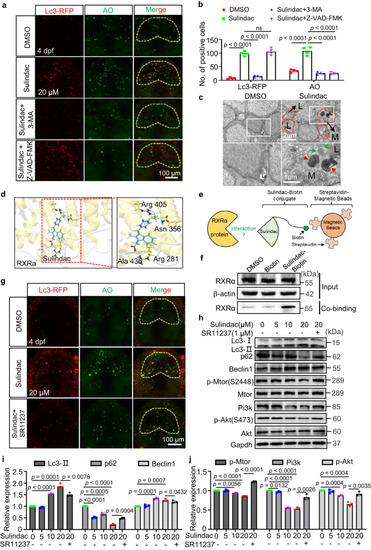
Sulindac promoted RXRa-dependent autophagy-induced apoptosis through the PI3K/AKT/mTOR pathway in zebrafish neurons. a Autophagy and apoptosis were evaluated according to Lc3-RFP and AO signals when treated with 3-MA (autophagy inhibitors) or Z-VAD-FMK (apoptosis inhibitors) before sulindac treatment. b Quantification of Lc3-RFP+ and AO+ cells in the midbrain of embryos. The values represent the means ± SDs (n = 4 larvae for per group, each dot denotes one larva). NS, not significant. Statistics calculated by unpaired two-tailed Student’s t test. c Transmission electron micrograph analysis of autophagy measured in the midbrains of embryos treated with sulindac or DMSO. Small autophagosomes (green arrows) and autolysosomes (dashed lines) contained degraded cellular debris (red arrows), lysosomes (L), and mitochondria (M). The experiment was repeated once with similar results, and three zebrafish were observed in each group. d A docking study was performed to evaluate the interaction of RXRa (PDB ID: Q90416) with sulindac (Zinc ID: 3786192) via the SwissDock server (http://www.swissdock.ch/). The most favourable binding mode showed four hydrogen bonds and had a full fitness of −2523.73 kcal/mol with −7.56 kcal/mol docked free energy; the close-up view is represented in the right panel. e Schematic diagram of the use of the streptavidin–biotin (SA–biotin) system to acquire proteins bound to sulindac. f Western blot analysis showed that there was an interaction between sulindac and RXRa protein in zebrafish head tissue. The experiment was repeated three times independently with similar results. g Autophagy and apoptosis were evaluated according to Lc3-RFP and AO signals upon treatment with SR11237 before sulindac treatment. The experiment was repeated twice with similar results, and at least five zebrafish were observed each time. h Western blot revealed the expression levels of autophagy-associated proteins and the PI3K/AKT/mTOR pathway proteins after treatment with increasing concentrations of sulindac as indicated. The immunoblot intensity was determined by ImageJ analysis software i, j The data are presented as the means ± SDs (n = 3 independent biological replicates). Statistics calculated by unpaired two-tailed Student’s t test. Source data are provided as a Source Data file. GAPDH was used as an internal control.
|