
Fig. 5
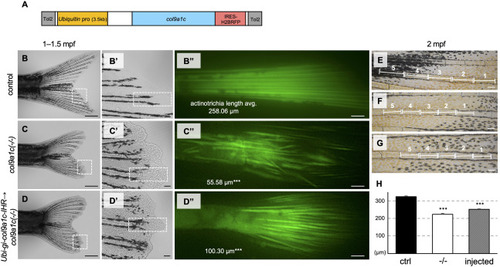
Fig. 5. Rescues experiments by microinjection of col9a1c under the ubiquitin promoter. (A) Schematic illustration of the col9a1c expression construct. The expression of col9a1c driven by the ubiquitin promoter. IRES-H2BRFP was used to confirm that the introduced gene is expressed in the fins. (B, C, D) The phenotype in the control fin, the col9a1c(-/-) fin, and the col9a1c-overexpressioned c(-/-) in F0 generation, respectively. The samples at 1- to 1.5-month-old with similar standard length were compared. White dashed box in each figure indicate the magnified area shown in B′, C′, and D’. (B″, C″, D″) The labelled actinotrichia in the region indicated by white dashed box in B′, C′, and D′, respectively. The number in each image represents the average of actinotrichia length (N = 30 from each group, i.e. each three individuals with 10 actinotrichia; t-test (vs. control), ∗∗∗p < 0.001). The length was restored by 17% in the knockout fish injected with the construct, although there were still statistically significant differences. (E, F, G) The five segments comprising the fourth fin-ray from the ventral side (V4) and being just before the first bifurcation at around 2-month-old in the control fin, the col9a1c(-/-) fin, and the col9a1c-overexpressioned col9a1c(-/-), respectively. The reason for showing the V4 fin-ray is that G is the same individual as D, and the actinotrichia at the tip of this fin-ray was rescued as seen in D″. These segments were used for the measurement of the segment length. (H) The result of the segment length measurement (N = 50 each from group, i.e. each five individuals with 5 segments; t-test (vs. control), ∗∗∗p < 0.001). The length was restored by approximately 10% in the knockout fish injected with the construct, although statistical analysis still showed a significant size difference with the segments of control fish. Scale bars: 500 μm in B, C, D; 50 μm in B′, C′, D′; 20 μm in B″, C″, D″; 100 μm in E, F, G. |
Reprinted from Developmental Biology, 481, Nakagawa, H., Kuroda, J., Aramaki, T., Kondo, S., Mechanical role of actinotrichia in shaping the caudal fin of zebrafish, 52-63, Copyright (2021) with permission from Elsevier. Full text @ Dev. Biol.