
- Title
-
Mechanical role of actinotrichia in shaping the caudal fin of zebrafish
- Authors
- Nakagawa, H., Kuroda, J., Aramaki, T., Kondo, S.
- Source
- Full text @ Dev. Biol.
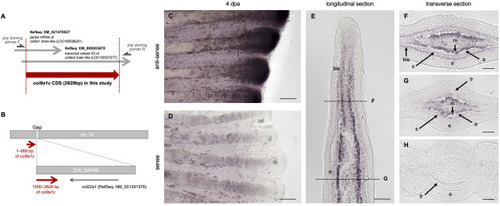
Fig. 1. Identification of col9a1c, newly isolated in this study. (A) Schematic diagram of the region of the isolated cDNA in this study (red arrow). This cDNA was named col9a1c (accession number: LC546948). (B) Schematic diagram of the position of the col9a1c in the database. Although the front part (1–999 bp) and the latter part (1000–2829 bp) are now on two different scaffolds, we inferred the unknown scaffold (Zv9_NA466) locates in the gap region of the chromosome (chr) 19 with considering the orientation of col9a1c gene. (C, D) Whole-mount in situ hybridization (ISH) of col9a1c for regenerated fins at 4 days post-amputation (dpa). Stronger expression was observed in the fin-tip. (E–H) ISH on cryo-sections of longitudinal (E) and transverse (F to H) at 4 dpa. The dot lines in E indicate the approximate positions of the transverse sections shown in F and G, respectively. At more distal fin-tip, stronger expression of col9a1c was observed in mesenchymal cells and the expression was also detected in basal layer of epidermis (F). More proximal region, the expression was mainly and strongly detected in mesenchymal cells (G). The expression was not observed in the proximal part of the regenerated fin, where thick fin-ray was present (H). ble: basal layer of epidermis, fr: fin-ray, s: scleroblast, e: epidermis, m: mesenchymal cells, a: actinotrichia. Scale bars: 100 μm in C, D; 50 μm in E; 25 μm in F–H. |
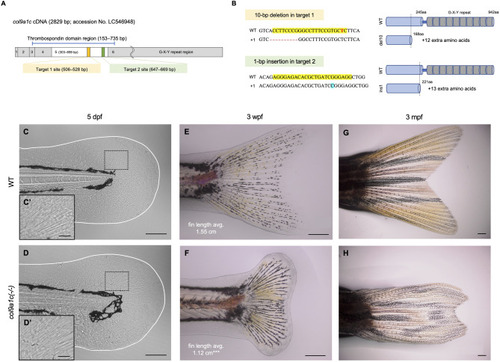
Fig. 2. Generation of col9a1c-knockout zebrafish and abnormal shape of the caudal fin in the knockout. (A) The col9a1c coding region map. The numbers in the boxes indicate exon number and the exon5 region is highlighted in white. The yellow and green box show the targeted region of CRISPR/Cas9. (B) Gene sequences around the target site (highlighted in yellow) and schematic of the structure of col9a1c protein in the wild-type (WT) and knockout alleles. The 10-bp deletion (del10; 505–514 bp; red hyphens) in the target 1 site and the 1-bp insertion (ins1; at 664 bp; highlighted in blue) in the target 2 site caused a frameshift at the position 169 aa and 222 aa, respectively. Both mutations deleted all the G-X-Y repeats (grey column), which is a common and unique structure of collagen. The del10 mutation also deleted half of the thrombospondin domain (blue column) in exon5. The red and bold letter in the target 1 sequence indicates the position of the prp mutation (Huang et al., 2009). (C–H) Phenotype of col9a1c(-/-) fish in the caudal fin. K and L show the caudal fin fold at 5 days post-fertilization (dpf) of the WT and col9a1c(-/-) fish, respectively. Both their shape and size were indistinguishable. C′ and D′ are the magnified images of the black dashed box in C and D. Radially arranged actinotrichia were visible in both fin folds. E and F are the caudal fins at 3 weeks post-fertilization (wpf) in WT and col9a1c(-/-) fish. The number in each image represents the average of fin length (N = 5 each from control and col9a1c(-/-); t-test, ∗∗∗p < 0.001). G and H are adult fins of WT and col9a1c(-/-) fish. The caudal fin of col9a1c(-/-) fish was slightly shrunken along the anterior-posterior (AP) axis, whereas the contraction in the dorsal-ventral (DV) was more pronounced and the fin-rays were curved towards the center. In addition, there was few bifurcations of the fin-ray. Scale bars: 100 μm in C, D; 25 μm in C′, D′; 300 μm in E, F; 500 μm in G, H. |
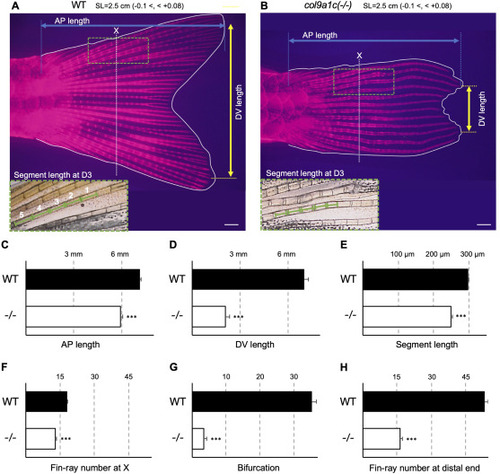
Fig. 3. Disturbed fin-ray configuration in adult col9a1c(-/-) zebrafish. (A, B) Representative fin images of WT and col9a1c(-/-) fish. Ten fishes were used for this measurement from each group and the standard length was adjusted to 2.5 mm (-0.1 <, < +0.08). Fin-rays were stained with Alizarin Red. AP length was measured as the distance (blue double-headed arrow) from the root of fin-rays to their most elongated tip (blue dot lines). DV length was measured as the distance (yellow double-headed arrow) between the most elongated tip of the fin-rays in each region of dorsal and ventral (yellow dot lines). The white dotted lines A and B indicate the position of X where the fin-ray outside D1 or V1 stops extending. The five segments comprising the third fin-ray from the dorsal side (D3), around the position X, were used to measure segment length (green dashed box). (C–G) The results of the analysis; AP length, DV length, segment length, the number of fin-rays at X, bifurcation, and the number of fin-rays at the distal end, respectively. Scale bars: 500 μm. (t-test, ∗∗∗p < 0.001). |
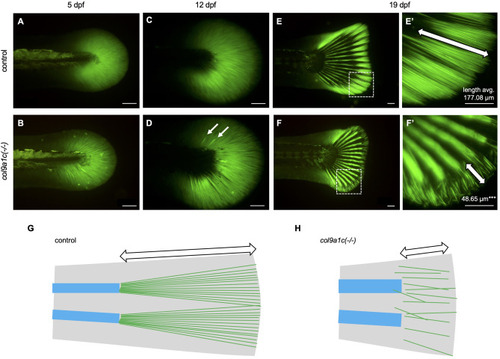
Fig. 4. Decreased density of actinotrichia and disorganized placement during the growth of col9a1c(-/-) fish. In vivo visualization of actinotrichia with actinodin1-GFP (Kuroda et al., 2018). (A, B) 5 dpf. (C, D) 12 dpf. (E, F) 19 dpf. A, C and E are control. B, D, and F are col9a1c(-/-). White arrows in D indicate abnormally thicker actinotrichia. (E′, F′) Magnified images of white dashed box in E and F, respectively. The number in each image represents the average of actinotrichia length (N = 10 each from control and col9a1c(-/-); t-test, ∗∗∗p < 0.001). The white double-headed arrows indicate the tip of the fin, an area where the fin-ray has not yet formed. This part is physically supported by the actinotrichia. (G, H) Schematic illustration at the fin tip. The fin is shown in grey. The blue boxes and green lines indicate fin-rays and actinotrichia, respectively. White double-headed arrows indicate the actinotrichia region. Scale bars: 100 μm. |
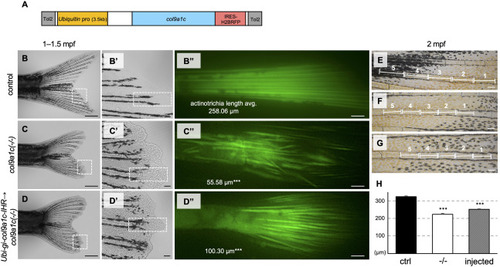
Fig. 5. Rescues experiments by microinjection of col9a1c under the ubiquitin promoter. (A) Schematic illustration of the col9a1c expression construct. The expression of col9a1c driven by the ubiquitin promoter. IRES-H2BRFP was used to confirm that the introduced gene is expressed in the fins. (B, C, D) The phenotype in the control fin, the col9a1c(-/-) fin, and the col9a1c-overexpressioned c(-/-) in F0 generation, respectively. The samples at 1- to 1.5-month-old with similar standard length were compared. White dashed box in each figure indicate the magnified area shown in B′, C′, and D’. (B″, C″, D″) The labelled actinotrichia in the region indicated by white dashed box in B′, C′, and D′, respectively. The number in each image represents the average of actinotrichia length (N = 30 from each group, i.e. each three individuals with 10 actinotrichia; t-test (vs. control), ∗∗∗p < 0.001). The length was restored by 17% in the knockout fish injected with the construct, although there were still statistically significant differences. (E, F, G) The five segments comprising the fourth fin-ray from the ventral side (V4) and being just before the first bifurcation at around 2-month-old in the control fin, the col9a1c(-/-) fin, and the col9a1c-overexpressioned col9a1c(-/-), respectively. The reason for showing the V4 fin-ray is that G is the same individual as D, and the actinotrichia at the tip of this fin-ray was rescued as seen in D″. These segments were used for the measurement of the segment length. (H) The result of the segment length measurement (N = 50 each from group, i.e. each five individuals with 5 segments; t-test (vs. control), ∗∗∗p < 0.001). The length was restored by approximately 10% in the knockout fish injected with the construct, although statistical analysis still showed a significant size difference with the segments of control fish. Scale bars: 500 μm in B, C, D; 50 μm in B′, C′, D′; 20 μm in B″, C″, D″; 100 μm in E, F, G. |

Fig. 6. The fin and fin-rays shape are not affected by the disorganization of blood vessel. (A, B) Fluorescent images of blood vessels at the adult fin tip visualized by fli1a:mCherry-CaaX in control (A) and col9a1c(-/-) (B). (C–H) Fluorescent images of blood vessels in regeneration fin at 14 dpa and 21 dpa in control (C and D), col9a1c(-/-) (E and F), and UV-irradiated control fin (G and H). As shown in G and H, UV-stimulated fin also showed the tangled vascular network at the fin tip (white arrows) and the blood vessels in inter-ray region (blue arrows) as seen in col9a1c(-/-) fin (white arrows in E and F, blue arrow in F). (D′, F′, H′) Fluorescent images of actinotrichia visualized actinodin1-GFP at 21 dpa in control, col9a1c(-/-), and UV- irradiated control fin, respectively. The white dashed box in each figure indicates the area in the magnified image surrounded by white line. Although the UV-stimulated fin had abnormal blood vessels as shown in G and H, the alignment of actinotrichia was intact and indistinguishable from the control fin (compare H′ with D′). (I) Analysis of the orientation angle of actinotrichia. The upper schematic diagram represents the analysis method. The angle between the midline of fin-ray and the straight line extended from actinotrichia was measured using D′, F′, and H′ (N = 10 from each group). Actinotrichia are usually arranged radially with respect to fin-ray, so the angle is very small. Conversely, larger angles mean the direction of actinotrichia is disturbed. As the results show, actinotrichia in the knockout were distributed at various angles due to their mis-arrangement, while they in control and UV-irradiated fin were distributed between 0 and 30°. The result indicates that UV irradiation did not affect the actinotrichia orientation. (D″, F″, H″) The phenotype of fin and fin-rays in control, col9a1c(-/-), and UV-irradiated control fin including the area shown in D and D′, F and F′, H and H′, respectively. The col9a1c(-/-) fin shrunk in dorsoventrally and had the wavy fin-rays (white arrow), whereas UV-stimulated fin showed normal fin and fin-rays seen in control. (J) Measurement of segment length (N = 15 each from group, i.e. each three individuals with 5 segments on the D3 fin-ray; t-test (vs. control), ∗∗∗p < 0.001). The magnified view is the area surrounded by the white dashed box in D″, F″, and H″, respectively. As the result shown, the segment length was also unaffected by UV irradiation. Scale bars: 100 μm in A–H, D′, F′, H′; 500 μm in D″, F″, H″. |

Fig. 7. Density and placement of actinotrichia at the tip of the fin in 3-week-old fish. (A, B) The actinotrichia of the fin tip in 3-wewk-old visualized with actinodin1-GFP (Kuroda et al., 2018). The fin-rays were visualized using Alizarin Red to set the starting point of transverse section. White dot lines in A and B indicate the positions of transverse sections in C, D, E, and F. (C, D) Transverse sections control (C) and col9a1c(-/-) (D). (E, F) Magnified images of white dashed boxes in C and D, respectively. The section interval was 40 μm in C and 20 μm in D. The same actinotrichia were chased from 1 to 6. (G, H) Schematic of actinotrichia arrangement in the fin deduced from the images of the sections. Scale bars: 20 μm in A, B; 10 μm in C, D; 5 μm in E, F. |

Fig. 8. Orderly arrays of actinotrichia provide a scaffold for epidermal cells to spread. (A) Schematic diagram of the cross-section at the fin tip modified from Kuroda et al. (2018). (B–G) Fin tip region of the control (B to D) and col9a1c(-/-) (E to G) of 5 dpf fish. Cell membrane of superficial cells (SCs) visualized by phalloidin (B and E). Cell membrane of basal keratinocytes (BKs) expressing mCherry-CaaX under the and1 promoter (Kuroda et al., 2018) (C and F). Optical section at the dot line in C and F (D and G). Cell nuclei (blue) were visualized with Hoechst. (H) Cell area of SCs and BKs at 5 dpf (N = 3 each from group). There was no significant difference in either cell. (I) Tissue thickness in D and G. The thickness was measured every 30 μm, starting from the distal tip of the fins. No significant difference in cell thickness between the control and the col9a1c(-/-) mutant. (J–O) Fin tip region of 3-week-old control (J to L) and col9a1c(-/-) fish (M to O). Cell membrane of SCs visualized by phalloidin (J and M). Cell membrane of BKs visualized with mCherry (K and N). Optical sections of the dot line in I and L (L and O). Cell nuclei (blue) were visualized with Hoechst. (L′ and O′) Magnified images of white dashed box in L, O. (P) Cell area of SCs and BKs at 3 wpf (N = 3 each from group). The cell area in col9a1c(-/-) was approximately 50% smaller in SCs and 70% smaller in BKs. (Q) Tissue thickness in L and O. The thickness was measured every 40 μm, starting from the distal tip of the fins. The col9a1c(-/-) mutant showed approximately twice the thickness of tissue compared to the control at every point. White arrowheads in D, G, L, and O indicate the boundary of the two arrayed cells in C, F, K, and N, respectively. Yellow arrow indicates the abnormally oriented nuclei of mesenchyme cells. Scale bars: 20 μm in B–L, M–O; 5 μm in L′, O′. |
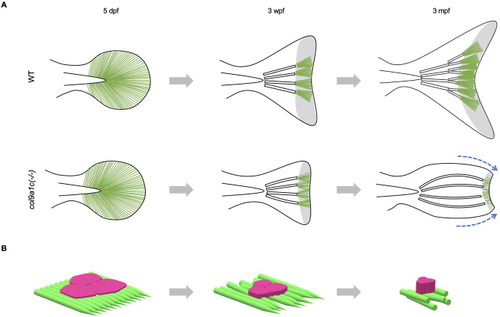
Fig. 9. The inferred actinotrichia function in zebrafish tail fin formation. (A) Growth of fins in WT (upper images) and col9a1c(-/-) (lower images) fish. In WT, actinotrichia are always dense at the tip, whereas in col9a1c(-/-), the number of actinotrichia decreases and their orientation becomes abnormal as the fish gets older. The fin gradually retracts along the DV axis, and the fin-ray also bends toward the center (blue dot arrows). In addition, there is little branching of the fin-ray. The green lines indicate the actinotrichia and the white bars indicate the fin-rays. The area of the actinotrichia at the tip of the fin is shown in grey. (B) Schematic diagram of the non-spread epidermal cells due to the disorderly actinotrichia arrangement in col9a1c(-/-). Each step corresponds to the fin growth in A. |
Reprinted from Developmental Biology, 481, Nakagawa, H., Kuroda, J., Aramaki, T., Kondo, S., Mechanical role of actinotrichia in shaping the caudal fin of zebrafish, 52-63, Copyright (2021) with permission from Elsevier. Full text @ Dev. Biol.