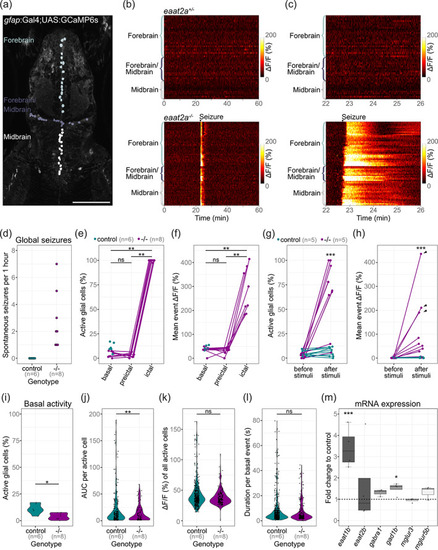
Astroglial network in eaat2a −/− mutants is silent yet hyperexcitable. (a) Two‐photon microscopy image of the forebrain and midbrain in a 5 dpf Tg(gfap:Gal4;UAS:GCaMP6s) zebrafish larva expressing GCaMP6s in GFAP positive glial cells. Individual astroglia along the ventricular regions are color‐coded according to three different areas: forebrain (light gray), forebrain/midbrain boundary region (dark gray), and midbrain (white). Scale bar is 100 μm. (b) Calcium signals (ΔF/F0) of individual glial cells over time in representative eaat2a +/− (top) and eaat2a −/− (bottom) larvae. Warm color indicates high activity as seen during the seizure in the eaat2a −/− larva. (c) Four‐minute periods of calcium signals in (b). (d) Number of global seizures detected in eaat2a −/− mutants (magenta) compared to their eaat2a +/− and eaat2a +/+ siblings (cyan). (e, f) Percentage of active glial cells (e) and average event amplitudes of active cells (f) of individual eaat2a −/− mutants during two‐minute basal/inter‐ictal, preictal and ictal (spontaneous seizures) periods. Cyan dots show average basal values of eaat2a +/+ and eaat2a +/− siblings. Figure legend in (e) also applies to (f). (g, h) Evaluation of one‐minute periods immediately before and after 10‐second light stimuli in eaat2a +/+ /eaat2a +/− (cyan) and eaat2a −/− (magenta) animals of the proportion of active cells (g) and averaged amplitude over all cells (h). Arrowheads indicate global seizures. n = 5 fish per group, 2 stimuli per fish. Figure legend in (g) also applies to (h). (i–l) Analysis during inter‐ictal basal periods of percentage active astroglia per fish (i), total activity of active cells (j, area under the curve = AUC), amplitudes (k) and durations (l) of individual calcium bursts in active glial cells are plotted in violin plots with individual data points (black). Control = eaat2a +/+ and eaat2a +/− . (m) mRNA transcript levels of eaat1b, eaat2b, gabra1, gad1b, mglur3 and mglur5b in 5 dpf eaat2a −/− relative to eaat2a +/+ siblings. Transcripts were measured by RT‐qPCR and normalized to g6pd and b2m. Data are represented in box‐and‐whisker plots with an interquartile range from first to third quartile and the median represented by the line within the boxes. Significance levels: ***p < .001, **p < .01, *p < .05, ns = not significant (p > .05), Wilcoxon signed rank test (e, f), Welch two sample unpaired t‐test (i, m) or Wilcoxon rank‐sum test (g, h, j–l). All statistics in Supplementary Table 3
|
