
Figure 5.
- ID
- ZDB-FIG-220522-19
- Publication
- Solman et al., 2022 - Inflammatory response in hematopoietic stem and progenitor cells triggered by activating SHP2 mutations evokes blood defects
- Other Figures
- All Figure Page
- Back to All Figure Page
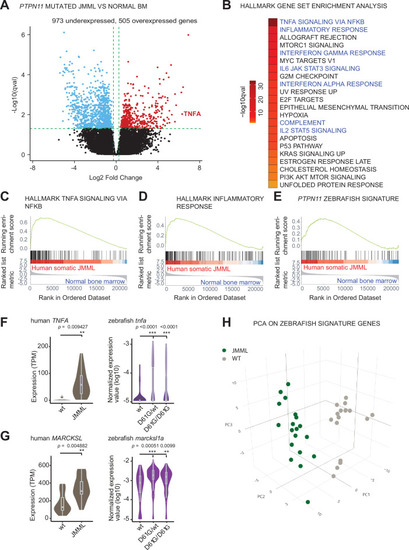
(A) Volcano plot of differentially expressed genes of HSPCs derived from bone marrow of JMML patients with PTPN11 mutations (n = 5) and healthy bone marrow (n = 7). Underexpressed genes are marked in blue and overexpressed genes are marked in red. TNFA expression is highlighted. Green dashed lines indicate the significance level. (B) Gene set enrichment analysis (GSEA) for the MSigDB’s hallmark gene sets in HSPCs from JMML compared to normal human age-matched bone marrow. GSEA plots for TNFA_SIGNALING_VIA_NFKB (C), INFLAMMATORY RESPONSE (D), and the custom zebrafish signature based on the top 100 human orthologous of genes upregulated in monocyte/macrophage progenitor cluster of zebrafish HSPCs (E). Violin plots show the expression of TNFA (F) and MARCKSL (G) in either human wild type (wt) vs. JMML HSPCs, and zebrafish Shp2wt vs. Shp2D61G/wt and Shp2D61G/D61G monocyte/macrophage HSPC progenitors. **p < 0.01, ***p < 0.001, t-test. (H) Principal component analysis (PCA) for the 100 genes included in the custom zebrafish signature. Green dots represent PTPN11 mutated JMML, gray ones represent normal human age-matched bone marrow. PC1: 19% of the variance, PC2: 16% of the variance, PC3: 14% of the variance.
|