|
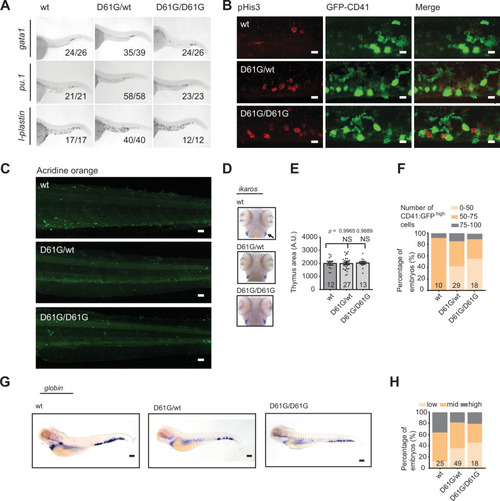
Hematopoiesis in Shp2<italic toggle='yes'><sup>D61G</sup></italic> zebrafish.(A) Representative images of the whole-mount in situ hybridization (WISH) staining for gata1, pu.1, and l-plastin expression in the tail region of 48 hr post fertilization (hpf) old Shp2wt, Shp2D61G/wt, and Shp2D61G/D61G zebrafish embryos. Scale bar, 250 µm. Numbers in the pictures indicate the number of embryos with the phenotype represented in the image. (B) Cell proliferation was assessed in the caudal hematopoietic tissue (CHT) region of 5 days post fertilization (dpf) old Shp2wt, Shp2D61G/wt, and Shp2D61G/D61G embryos in the Tg(cd41:GFP) background by immunohistochemistry using antibodies specific for phosphohistone H3 (pHis3) and GFP. Cells positive for both GFP and pHis3 are indicated with white arrows in the merge panel. Scale bar, 10 μm. (C) Representative images of the Acridine orange staining of the CHT region of the 5 dpf old Shp2wt, Shp2D61G/wt, and Shp2D61G/D61G embryos. Scale bar, 50 μm. (D) WISH of 5 dpf Shp2wt, Shp2D61G/wt, and Shp2D61G/D61G embryos using ikaros-specific probe. Thymus is indicated (arrow). (E) Size of ikaros-positive thymus, NS, non-significant, ANOVA complemented by Tukey’s HSD. (F) Number of cd41:GFPhigh cells in Shp2wt, Shp2D61G/wt, and Shp2D61G/D61G zebrafish embryos at 5 dpf were counted and percentage of embryos with either 0–50, 50–75, or 75–100 cd41:GFPhigh cells was plotted. (G) WISH of 5 dpf Shp2wt, Shp2D61G/wt, and Shp2D61G/D61G embryos using β-globin-specific probe. Scale bar, 150 μm. (H) Quantification of β-globin expression in Shp2wt, Shp2D61G/wt, and Shp2D61G/D61G embryos scored as low, mid, and high. (E,F,H) Measurements originate from at least three distinct experiments. Numbers on the bars depict the number of embryos.
|