
Figure 2
- ID
- ZDB-FIG-220522-13
- Publication
- Solman et al., 2022 - Inflammatory response in hematopoietic stem and progenitor cells triggered by activating SHP2 mutations evokes blood defects
- Other Figures
- All Figure Page
- Back to All Figure Page
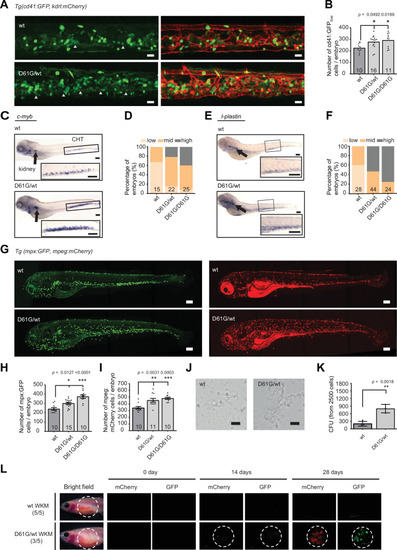
(A) Representative images of the caudal hematopoietic tissue (CHT) region of Shp2wt and Shp2D61G zebrafish embryos in Tg(cd41:GFP, kdrl:mCherry-CAAX) background at 5 days post fertilization (dpf). cd41:GFPlow cells mark hematopoietic stem and progenitor cells (HSPCs) and cd41:GFPhigh cells thrombocytes. Gray arrow heads indicate cd41:GFPlow cells. Scale bar, 20 μm. (B) The low-intensity cd41:GFP-positive cells in the CHT region were counted. (C) Whole-mount in situ hybridization (WISH) of 5 dpf Shp2wt and Shp2D61G/wt embryos using c-myb-specific probe. Head kidney (arrow) and CHT (box) are indicated; zoom-in in inset. Scale bars, 150 μm. (D) Quantification of c-myb WISH. C-myb expression in Shp2wt, Shp2D61G/wt, and Shp2D61G/D61G embryos was scored as low, mid, and high. (E) WISH of 5 dpf Shp2wt and Shp2D61G/wt embryos using l-plastin-specific probe. Head kidney (arrow) and CHT (box) are indicated and zoom-in in inset. Scale bars, 150 μm. (F) Quantification of l-plastin expression in Shp2wt, Shp2D61G/wt, and Shp2D61G/D61G embryos scored as low, mid, and high. (G) Representative images of Shp2wt and Shp2D61G zebrafish embryos in Tg(mpx:GFP, mpeg:mCherry) background at 5 dpf. Mpx:GFP marks neutrophils and mpeg:mCherry macrophages. Scale bars, 150 μm. (H,I) Number of mpx:GFP and mpeg:mCherry-positive cells per embryo. (J) Representative images of colonies developed from cd41:GFPlow cells isolated from the CHT of 5 dpf Shp2wt and Shp2D61G/wt zebrafish embryos, grown in methylcellulose with zebrafish cytokine granulocyte colony stimulating factor a (Gcsfa) for 2 days. Scale bar, 50 μm. (K) Quantification of number of colonies from J, t-test. (L) WKM cells harvested from Shp2wt and Shp2D61G zebrafish in the Tg(mpx:GFP, mpeg:mCherry) background were injected into the peritoneum of adult prkdc-/- zebrafish. Recipients were monitored by fluorescence imaging. (B,D,F,H,I,K) Measurements originate from at least three distinct experiments. Number on bars: number of embryos. (B,H,I,K) Error bars represent SEM. *p < 0.05, **p < 0.01, ***p < 0.001. (B,H,I) ANOVA complemented by Tukey’s HSD.
|