|
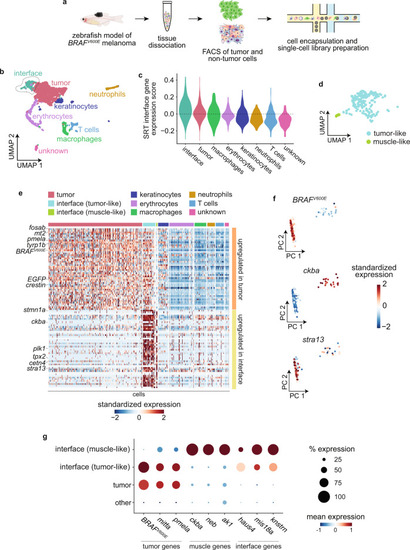
The tumor–microenvironment interface is composed of specialized tumor and muscle cells.a Schematic showing scRNA-seq experiment workflow. b UMAP dimensionality reduction plot for 2889 cells sequenced as in a. Cluster/cell type assignments are labeled and colored. c Expression score per cell (scRNA-seq) for average expression of interface marker genes from the SRT interface cluster. d Inset of the outlined interface cluster in b showing the two interface subclusters. e Heatmap showing expression of the top 50 genes upregulated in the tumor cell cluster (top, orange) and interface cell cluster (bottom, yellow). Selected genes are labeled. f Principal component analysis of cells in the interface cluster, scored for expression of the tumor marker BRAFV600E, the muscle marker ckba, and the centromere gene stra13. Scores for principal components 1 and 2 are plotted. Cells are labeled by standardized expression of the indicated genes. g Dot plot showing expression of tumor and muscle markers. The size of each dot corresponds to the percentage of cells in that cluster expressing the indicated gene, and the color of each dot indicates the expression level.
|