|
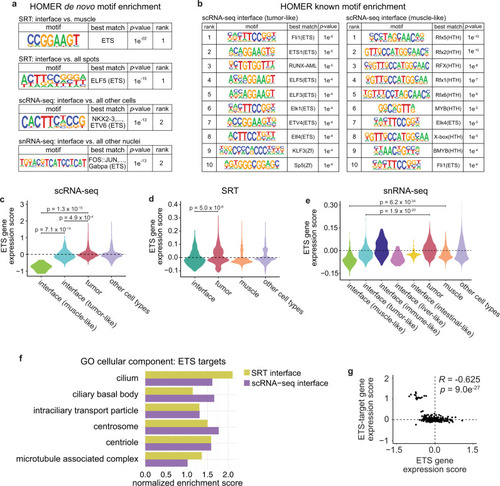
ETS transcription factors may regulate cilia gene expression at the interface.a Results from HOMER de novo motif analysis of differentially expressed genes in the SRT, scRNA-seq, and snRNA-seq interface clusters. b Top ten enriched motifs from HOMER known motif analysis of the scRNA-seq tumor-like (left) and muscle-like (right) interface cell states. a, bp-values calculated using the hypergeometric test (one-tailed). c–e Relative expression of zebrafish ETS genes across the clusters in the scRNA-seq (c), SRT (d), and snRNA-seq (e) datasets. p-values are noted (Wilcoxon rank sum test, two-sided, with Bonferroni’s correction). f Normalized enrichment score of cilia-related pathways enriched in ETS-target genes within the SRT and scRNA-seq interface clusters. g Scatter plot comparing ETS gene expression scores per cell and ETS-target gene expression scores per cell in the scRNA-seq interface cluster. Pearson’s correlation coefficient (R) and p-value of correlation (two-sided) is indicated.
|