|
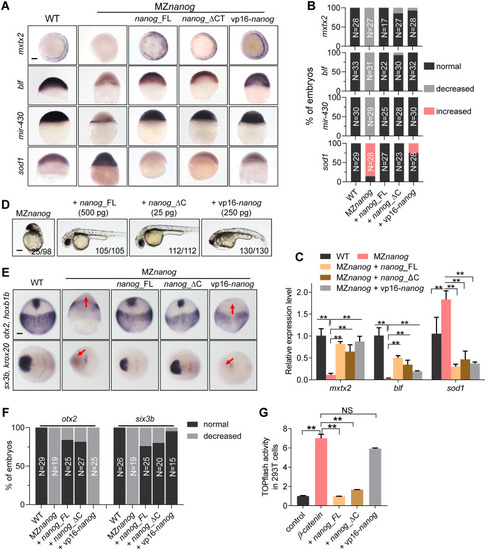
N-terminal of Nanog is required for its Wnt/β-catenin repressive activity.(A) WISH analysis showing the expression of mesendoderm marker, mxtx2, strictly zygotic gene, blf, and microRNA-430 precursor (mir-430), and miR-430 target, sod1 in embryos of WT, MZnanog, MZnanog injected with nanog_FL, nanog_ΔC, or vp16-nanog mRNA. Expression of mxtx2, blf, and mir-430 was reduced, even absent, whereas expression of sod1 was significantly increased in MZnanog embryos; overexpression of nanog_FL, nanog_ΔC, or vp16-nanog restored the expression of mxtx2, blf, and mir-430 and cleaned the expression of sod1 in MZnanog embryos. mxtx2, blf, and sod1 were detected at 6 hpf, and mir-430 was detected at 4 hpf. Scale bar, 100 μm. (B) Statistical analysis of embryos in panel A. N represents analyzed embryo number. (C) Relative mRNA level of mxtx2, blf, and sod1 in WT, Mznanog, and the rescued embryos at 6 hpf examined by RT-qPCR analysis. Error bars, mean ± SD, **P < 0.01. (D) Overexpression of nanog_FL, nanog_ΔC, and vp16-nanog rescued the developmental defects of MZnanog. Both of nanog_FL and nanog_ΔC rescued embryos showed WT-like phenotype, whereas vp16-nanog rescued embryos still showed a forebrain defective phenotype. Phenotype was observed at 36 hpf. Scale bar, 100 μm. The numbers below the morphology pictures indicate number of embryos showing representative phenotype/total number of embryos. (E) WISH analysis showing the expression of neuroectoderm marker otx2 and forebrain marker six3b in embryos of WT, MZnanog, MZnanog injected with nanog_FL, nanog_ΔC, or vp16-nanog mRNA at 90% epiboly (for otx2) and 2-somite stage (for six3b). Expression of otx2 and six3b was absent in MZnanog embryos and restored by overexpression of nanog_FL or nanog_ΔC but not vp16-nanog. Red arrows indicate the absent expression of otx2 or six3b. Scale bar, 100 μm. (F) Statistical analysis of the embryos in panel E. N represents analyzed embryo number. (G) TOPflash assay showing co-transfection of nanog_FL (2 μg) or nanog_ΔC (2 μg) but not vp16-nanog (2 μg) significantly inhibited the up-regulated β-catenin transcriptional activity induced by β-catenin (0.5 μg) in HEK293T cells. Error bars, mean ± SD, **P < 0.01; NS means no significant difference. The P values in this figure were calculated by Student t test. The underlying data in this figure can be found in S1 Data. hpf, hours post fertilization; MZnanog, maternal zygotic mutant of nanog; nanog_FL, full length of Nanog; nanog_ΔC, C-terminal truncated Nanog; RT-qPCR, reverse-transcription quantitative PCR; vp16-nanog, Nanog homeodomain fusion with Vp16; WISH, whole-mount in situ hybridization; WT, wild type.
|