
Fig 7
- ID
- ZDB-FIG-200817-16
- Publication
- He et al., 2020 - Nanog safeguards early embryogenesis against global activation of maternal β-catenin activity by interfering with TCF factors
- Other Figures
- All Figure Page
- Back to All Figure Page
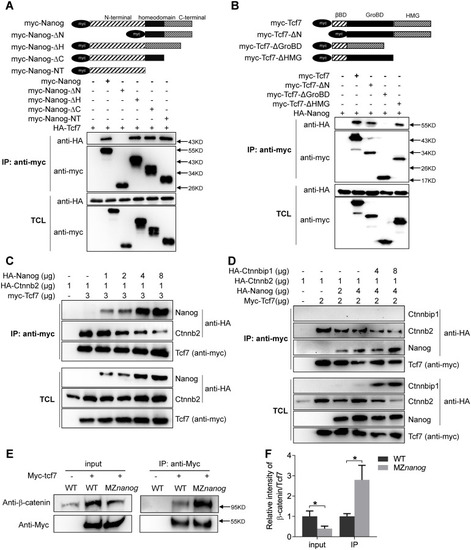
(A) Nanog interacts with Tcf7 through its N terminal. Different Myc-tagged Nanog were constructed and co-transfection with HA-Tcf7 in HEK293T cells. Among all the mutated types of Nanog, only the N-terminal truncated Nanog (Nanog-ΔN) could not coprecipitate with Tcf7, indicating that Nanog physically interacts with Tcf7 through its N terminal. (B) Tcf7 interacts with Nanog through its GroBD. Different Myc-tagged Tcf7 were constructed and co-transfection with HA-Nanog in HEK293T cells. Among all the mutated types of Tcf7, only the GroBD deleted Tcf7 (Tcf7_ΔGroBD) could not coprecipitate with Nanog, indicating that Tcf7 binds with Nanog through GroBD. (C) Nanog and β-catenin competitively binds with Tcf7. Co-transfection of increasing amount of Nanog decreases the interaction between β-catenin and Tcf7 in a dose-dependent manner. When increased amount of Nanog was transfected into Tcf7 and β-catenin co-transfected cells, decreased amount of β-catenin could be coprecipitated. The molecular weight of HA-Nanog is around 55 Kda, and HA-β-catenin is around 100 KDa, so we could distinguish the 2 anti-HA bands by different protein sizes. (D) Co-transfection of Ctnnbip1 increased the binding affinity between Nanog and Tcf7. Two different amounts of HA-ctnnbip1 were co-transfected with Tcf7, Nanog and β-catenin in HEK293T cells; because Ctnnbip1 was overexpressed, an increased amount of Nanog was coprecipitated by myc-Tcf7. The molecular weight of HA-ctnnbip1 is around 10 KDa. Note that HA-β-catenin level was reduced when Ctnnbip1 was overexpressed. (E) Co-immunoprecipitation assay showed that increased amount of endogenous β-catenin could interact with Tcf7 in MZ |
| Fish: | |
|---|---|
| Observed In: | |
| Stage: | Sphere |