|
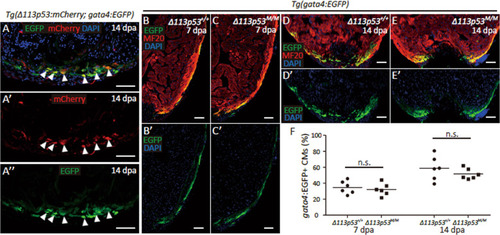
Depletion of Δ113p53 does not significantly impair the activation of <italic>gata4</italic><sup>+</sup> cells and their migration to the edge of the wound site during heart regeneration.a Co-localisation of red (Δ113p53+ cells) (a′) and green fluorescence (gata4+ cells) (a′′) on the cryosections of Tg(Δ113p53:mCherry; gata4:EGFP) hearts at 14 dpa. The white arrow heads indicate co-labelling. The nucleus were stained with DAPI (in blue). The representative picture was taken from three hearts. Scale bar, 50 μm. b–e Cryosections of Tg(gata4:EGFP); Δ113p53+/+ (b, b′, d, d′) and Tg(gata4:EGFP); Δ113p53M/M hearts (c, c′, e, e′) at 7 and 14 dpa, were immunostained by anti-GFP (in green) and anti-MF20 (in red) antibodies. The nucleus were stained with DAPI (in blue). Scale bar, 50 μm. f Average size of EGFP+ cardiomyocytes on the edge of wound site in Tg(gata4:EGFP); Δ113p53+/+ and Tg(gata4:EGFP); Δ113p53M/M mutant zebrafish at 7 and 14 dpa, was presented as the percentage of the ventricular area at the resection site. Data are means of three sections/heart from six hearts/time point. Scale bar, 50 μm. Each dot represents an individual heart. The experiments were repeated independently for at least three times with similar results. Statistical analysis was performed on relevant data using Student’s two-tailed t test in GraphPad Prism 5. The p values were represented by n.s. and asterisks. n.s., p > 0.05. *p < 0.05. **p < 0.01. ***p < 0.001.
|