|
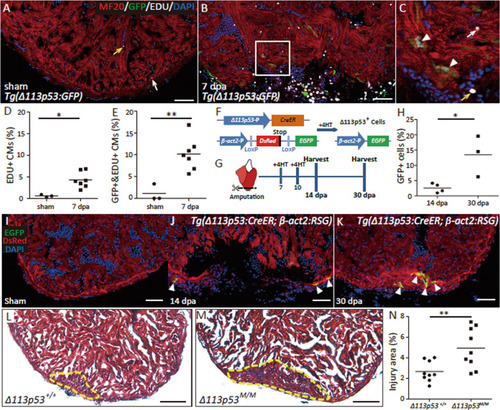
<italic>Δ113p53</italic>-positive cardiomyocytes undergo cell proliferation and contribute to heart regeneration.a–e Cryosections of Edu-labelled Tg(Δ113p53:GFP) hearts at sham (a) and 7 dpa (b, c) were immunostained by anti-GFP (in green) and anti-MF20 (in red) antibodies. The nucleus were stained with DAPI (in blue). Framed area in b was magnified in c. The representative picture was taken from 3 to 7 hearts. Scale bar, 50 μm. Yellow arrows: Edu+/GFP−/MF20− cells; white arrows: Edu+/GFP-/MF20+ cells; white arrow head: Edu+/GFP+/MF20+ cells. The number of Edu+/MF20+ cells on heart sections of Tg(Δ113p53:GFP) at sham and 7 dpa, was presented as the percentage of the total MF20+ cells at the wound site (d). The number of Edu+/GFP+/MF20+ cells on heart sections of Tg(Δ113p53:GFP) at sham and 7 dpa, was presented as the percentage of the total GFP+/MF20+ cells at the wound site (e). Data are means of 4–6 sections/heart with the largest wound area from 3 to 7 hearts in different treatments. Scale bar, 50 μm. Each dot represents an individual heart. f A schematic diagram representing the 4HT-based Cre-LoxP system driven by Δ113p53 promoter. Δ113p53-P (blue arrow): the 3.6-kb DNA fragment from the upstream of Δ113p53 transcription start site; β-act2-P (blue arrow): the promoter of β-actin2; CreER (Brown bar): the coding region of tamoxifen-inducible Cre recombinase–oestrogen receptor fusion protein; LoxP (blue bar): the site of LoxP; DsRed (red bar): the coding region of DsRed; Stop (black bar): the translation stop codon; EGFP (light green bar): the coding region of EGFP gene; 4HT: the treatment of 4-hydroxytamoxifen. g Schematics of the cell lineage tracing experiment. Either sham or surgical Tg(Δ113p53:CreER; β-act2:RSG) zebrafish were treated with 4HT at 7 and 10 dpa as indicated. The treated surgical zebrafish were sampled at 14 and 30 dpa, while all of the treated sham zebrafish were sampled at 30 dpa. h–k Red and green fluorescence on the cryosections of Tg(Δ113p53:CreErt2;β-actin:RSG) hearts at sham (i), 14 (j) and 30 dpa (k) were from the en vivo DsRed and EGFP protein respectively. The nuclei were stained with DAPI (blue). Scale bar, 50 μm. The number of EGFP+ cells on heart sections of Tg(Δ113p53:CreER; β-act2:RSG) at 14 and 30 dpa, was presented as the percentage of the total DsRed+ cells at the resection site (h). Data are from the biggest section with most EGFP+ cells of every heart. Each dot represents an individual heart. l–n Fibrin clot stained with Masson’s trichrome on the crysections of Δ113p53+/+ (l) and Δ113p53M/M mutant hearts (m) at 30 dpa. Yellow dotted lines indicate the approximate injury area. Scale bar, 50 μm. Average injury area with fibrin clots on sections of Δ113p53+/+ and Δ113p53M/M mutant hearts at 30 dpa was presented as the percentage of the total ventricular area (n). Data are means of three sections/heart. Each dot represents the average injury area of an individual heart. The experiments were repeated independently for at least three times with similar results. Statistical analysis was performed on relevant data using Student’s two-tailed t test in GraphPad Prism 5. The p values were represented by n.s. and asterisks. n.s., p > 0.05. *p < 0.05. **p < 0.01. ***p < 0.001.
|