|
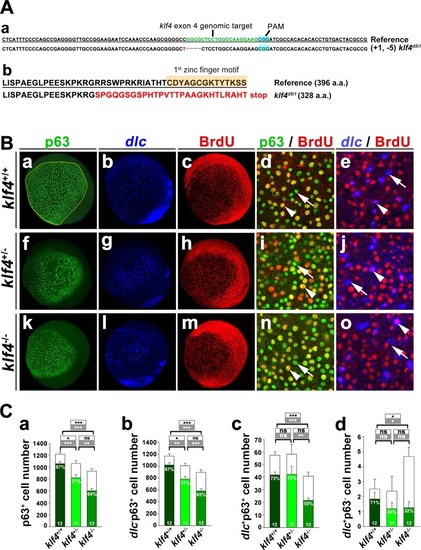
Knockout of <italic>klf4</italic> reduced proliferation of epidermal stem cells and <italic>dlc</italic><sup>+</sup> ionocyte progenitor cell number.(A) (a) Partial nucleotide sequence of wild-type (reference) klf4, showing sgRNA (green lettering) targeted to exon 4 is shown. The klf4d5i1 mutant had a 1 bp insertion (red lettering) and 5 bp deletion (dashed line). Protospacer adjacent motif (PAM) sequence is shown in blue. (b) Predicted amino acid sequence of klf4 with the first zinc finger motif in wild type is compared to the misframed zinc finger domain and stop codon (red lettering) in klf4d5i1 mutants. (B) Images of BrdU-labeled klf4+/+, klf4+/- or klf4-/- embryos, followed by staining with dlc antisense RNA, and stained with anti-p63 and anti-BrdU antibodies at bud stage are shown. Both p63+ and p63+ BrdU+ cell number were enumerated in the circled area of klf4+/+, klf4+/- or klf4-/- embryos. Enlarged images of klf4+/+, klf4+/- or klf4-/-embryos stained with p63 and BrdU or dlc RNA probe and BrdU are shown. Examples of p63 and BrdU or dlc and BrdU colocalized (arrowhead) or non colocalzed (arrow) cells are shown. (C) Quantitative results from (B). Total p63+ or dlc- p63+ cell numbers (open bars) with BrdU+ cell numbers (filled bar) of klf4+/+, klf4+/- or klf4-/- embryos at bud stage are shown in (a) and (b). dlc+p63+ or dlc+p63- cell numbers (open bars) with BrdU+ cell numbers (filled bars) of klf4+/+, klf4+/- or klf4-/- embryos at bud stage are shown in (c) and (d). Statistical significance is indicated for comparisons of total cell numbers (open box) or BrdU+ cell numbers (filled box). Individual percentages of p63+BrdU+, dlc- p63+ BrdU+, dlc+ p63+ BrdU+ or dlc+ p63- BrdU+ cells of klf4+/+, klf4+/- or klf4-/- embryos at bud stage are indicated within the bar. Embryos are shown in lateral view. Statistical significance was determined by Student’s t-test. NS, not significant; *p < 0.05; **p < 0.01; ***p < 0.001. Error bars indicate standard error.
|