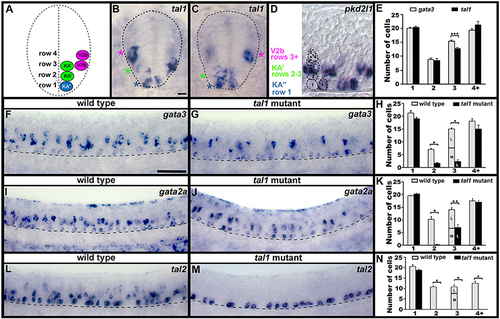
Spinal expression of tal1 and requirement in KA and V2b neurons. Cross-sectional (A–C) and lateral (D,F,G,I,J,L,M) views of 24 h zebrafish embryos. Dorsal, top; in lateral views, anterior, left. (A) Schematic indicating positions of KA″, KA′, and V2b neurons. (B,C) tal1 expression in KA″ (blue asterisks), KA′ (green asterisks), and V2b (magenta asterisks) cells. (D) Example of counting cells in different dorsal/ventral (D/V) “rows” (see section Materials and Methods). Row 3 contains both medial KA′ cells and lateral V2b cells. V2b cells are also located in row 4 and above. (E,H,K,N) Mean number of cells expressing specific genes in each D/V row of precisely-defined spinal cord region adjacent to somites 6–10. The approximate proportions of medial and lateral row 3 cells are indicated by horizontal lines separating the number of medially-located cells (bottom and indicated with an “M”) from the number of laterally-located cells (top and indicated with a “L”). All of the remaining gata3- and gata2a-expressing cells in row 3 of tal1 mutants were located laterally and were pear shaped, consistent with them being V2b cells, suggesting that no KA′ cells express these genes in tal1 mutants. tal1 and gata3 expression in 24 h WT embryos (E). gata3 (F–H), gata2a (I–K), and tal2 (L–N) expression in WT siblings and tal1 mutants. Dashed lines indicate spinal cord boundary (A–C) or ventral limit of spinal cord (F,G,I,J,L,M). gata2a expression ventral to spinal cord and in dorsal trunk is excluded from cell counts (I). Scale bars (B) = 10 microns (B–D); (F) = 50 microns (F,G,I,J,L,M). All counts were conducted blind to genotype and are an average of at least 4 embryos. Error bars indicate SEM. Statistically significant (p < 0.05) comparisons are indicated with brackets and stars. ***P < 0.001, **P < 0.01, *P < 0.05. P-values are provided in Supplementary Table 3.
|
