
Fig. 4
- ID
- ZDB-FIG-180709-39
- Publication
- Andrzejczuk et al., 2018 - Tal1, Gata2a, and Gata3 Have Distinct Functions in the Development of V2b and Cerebrospinal Fluid-Contacting KA Spinal Neurons
- Other Figures
- All Figure Page
- Back to All Figure Page
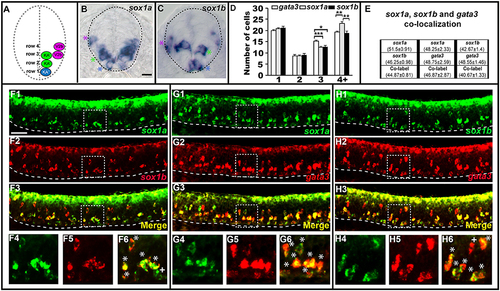
sox1a and sox1b are co-expressed in KA″, KA′, and V2b cells. Cross-sectional (A–C) and lateral (F–H) views of 24 h WT zebrafish embryos. Dorsal, top; in lateral views, anterior is left. Dashed lines indicate spinal cord boundary (A–C) or ventral limit of the spinal cord (F–H). (A) Schematic indicating positions of KA″, KA′, and V2b neurons. (B) sox1a and (C) sox1b expression in KA″ (blue asterisks), KA′ (green asterisks), and V2b (magenta asterisk) cells. (D) Mean number of cells expressing gata3, sox1a, or sox1b in each D/V row of spinal cord region adjacent to somites 6–10. All counts are an average of at least 5 embryos. Error bars indicate SEM. Statistically significant (P < 0.05) comparisons are indicated with square brackets and stars. ***P < 0.001, **P < 0.01, *P < 0.05. There are no statistically significant differences between the numbers of cells expressing each of these genes in rows 1 and 2. While there are differences in rows 3 and 4, these are small and may reflect slight differences in timing or levels of expression and/or “noise” between different experiments as each gene was analyzed in different embryos. For P-values of all comparisons see Supplementary Table 3. (E) Quantification of single and double-labeled cells from double fluorescent in situ hybridization experiments (F–H). Each column indicates the mean number of cells ±SEM expressing each gene and co-expressing the two genes. Double fluorescent in situ hybridization co-expression experiments showing expression of sox1a (green) and sox1b (red) (F), sox1a (green), and gata3 (red) (G), sox1b (green) and gata3 (red) (H). Bottom row panels are single confocal plane magnified views of the dashed box regions in panels above. White asterisks in (F6,G6,H6) indicate cells co-expressing both genes whereas white crosses indicate single-labeled cells. Dorsal labeling in (F1–H3) is background accumulated from several confocal planes. As labeling is often weaker in double in situ hybridization experiments, cells that are apparently single-labeled may co-express the other gene at levels undetected in these experiments. Consistent with this, slightly fewer cells are labeled with each in situ hybridization probe in the double-labeling experiments than in the single in situ hybridization experiments. In addition, occasional single-labeled cells may result from one of the genes being expressed slightly earlier than the other. Scale bars (B) = 10 microns (B,C); (F1) = 50 microns (F1–H3). |