
Fig. 4
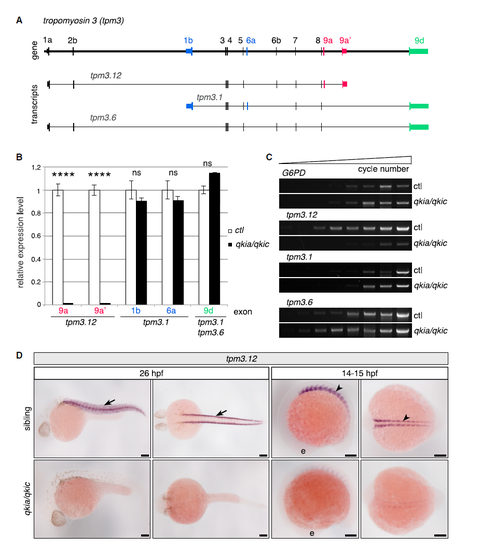
qkia and qkic Control tpm3.12 Transcript Level in Slow Muscle Cells (A) Schematic of the tropomyosin 3 gene and transcripts. Transcripts and exons are named according the nomenclature recommended in Geeves et al. (2015). tpm3.12- and tpm3.1-specific exons are indicated in red and blue, respectively, and the common exon between tpm3.1 and tpm3.6 transcripts is in green. (B) The expression of tpm3.12-specific exons is dramatically reduced in qkia/qkic embryos at 24–26 hpf, while the expression of tpm3.1- and tpm3.6-specific exons is not affected. Relative expression level of tpm3 transcripts in control (WT or qkia+/− embryos injected with control MO) versus qkia/qkic embryos (qkia−/− embryos injected with qkic MO) using exon-mapped reads from RNA sequencing. Expression in control embryos is set at 1 for each transcript. Data are presented as mean ± SEM; n = 3, p < 1 × 10−150 (see STAR Methods for details). ns, not significant. (C) qkia and qkic are specifically required to control tpm3.12 transcript level at 24–26 hpf. The expression of the three tpm3 transcripts was assessed using semi-quantitative RT-PCR in control (WT or qkia+/− embryos injected with control MO) versus qkia/qkic embryos (qkia−/− embryos injected with qkic MO) (n = 3). G6PD is used as a control gene. For each transcript, PCR products from both conditions were taken from successive PCR cycles and resolved by electrophoresis. (D) qkia and qkic control tpm3.12 expression in slow muscles from early somitogenesis. In situ hybridization on the offspring from the intercross of qkia+/−;qkic−/− carriers. In control siblings, tpm3.12 is expressed in trunk muscles (arrows) at 26 hpf (n = 67/90) and in slow muscle precursors (arrowheads) at 14/15 hpf (10/12-somite stage) (n = 37/50). In qkia−/−;qkic−/− embryos, tpm3.12 expression is downregulated at both 26 hpf (n = 23/90) and 14/15 hpf (n = 13/50). Lateral (left panel) and dorsal views (right panel) of the same embryo are shown. e, eye. In all panels, anterior is to the left. ∗∗∗∗p < 1 × 10⁻⁴. Scale bars, 100 μm. See also Figures S2–S4. |
| Gene: | |
|---|---|
| Fish: | |
| Knockdown Reagent: | |
| Anatomical Terms: | |
| Stage Range: | 10-13 somites to Prim-5 |
| Fish: | |
|---|---|
| Knockdown Reagent: | |
| Observed In: | |
| Stage Range: | 10-13 somites to Prim-5 |
Reprinted from Developmental Cell, 42(5), Bonnet, A., Lambert, G., Ernest, S., Dutrieux, F.X., Coulpier, F., Lemoine, S., Lobbardi, R., Rosa, F.M., Quaking RNA-Binding Proteins Control Early Myofibril Formation by Modulating Tropomyosin, 527-541.e4, Copyright (2017) with permission from Elsevier. Full text @ Dev. Cell