
Fig. 6
- ID
- ZDB-FIG-170427-5
- Publication
- Han et al., 2014 - Destabilizing LSD1 by Jade-2 promotes neurogenesis: an antibraking system in neural development
- Other Figures
- All Figure Page
- Back to All Figure Page
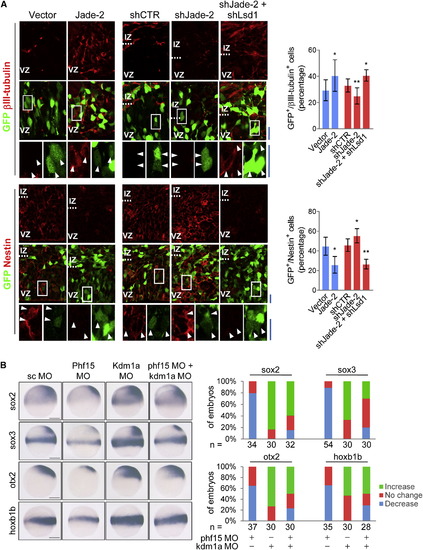
The Jade-2-LSD1 Pathway Is Implicated in Nervous System Development (A) The indicated electroporated cortical slices were analyzed by IF microscopy for βIII-tubulin or Nestin. The images of VZs and/or IZs are shown. Scale bar represents 20 μm. The percentage of GFP+/βIII-tubulin+, or GFP+/Nestin+ cells to GFP+ cells was quantified by ImageJ. Slices from two independent experiments were processed for each experimental condition. The results are mean ± SEM of three sections from each experiment. ∗p < 0.05 and ∗∗p < 0.01 (two-tailed unpaired Student’s t test). The images of “shCTR” refer to that in Figure 1E, given that the experiments with shLsd1, shJade-2, or shJade-2+shLsd1 were compared to the same control. (B) Ten nanograms of each of the indicated morpholinos were injected into one-cell stage embryos before the mRNA level of sox2, sox3, otx2, or hoxb1b was examined at 75% epiboly stage by whole-mount in situ hybridization. Lateral view of dorsal to the right is shown. Scale bar represents 200 μm. The number of observed live embryos (n) was quantified and the ratio of the affected embryos is shown. See also Figure S4. |
| Genes: | |
|---|---|
| Fish: | |
| Knockdown Reagents: | |
| Anatomical Term: | |
| Stage: | 75%-epiboly |
| Fish: | |
|---|---|
| Knockdown Reagents: | |
| Observed In: | |
| Stage: | 75%-epiboly |