
Fig. 7
- ID
- ZDB-FIG-170309-21
- Publication
- Wircer et al., 2017 - Homeodomain protein Otp affects developmental neuropeptide switching in oxytocin neurons associated with a long-term effect on social behavior
- Other Figures
- All Figure Page
- Back to All Figure Page
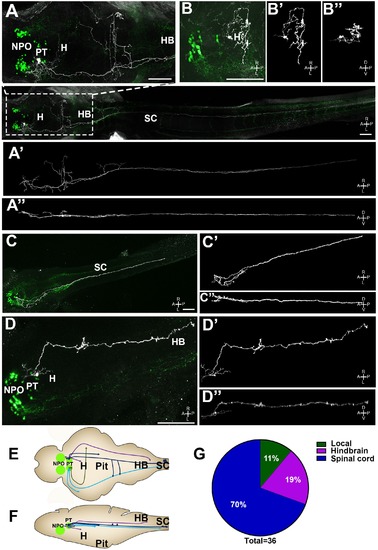
Single-cell projection mapping of posterior tuberculum (PT) OXT-ergic trajectories. (A–D) Confocal images showing representative single-cell genetic labeling of the PT OXT neurons (grey scale) in the context of the global OXT-ergic population in a oxt:egfp reporter (green). The 3D-traced projecting neurons are presented in A’–D’ (dorsal) and A’’–D’’ (lateral). Examples of OXT projections to the spinal cord (SC; A and C), local (B) and hindbrain (HB; D) projecting neuron are presented. The fish orientation is indicated at the bottom right corner of each image: A, anterior; D, dorsal; L, left, P, posterior, R, right; V, ventral. Scale bars, 100 µm. (E,F) Schemes illustrating dorsal (E) and lateral (F) views of the traced projecting neurons. (G) Pie chart showing the percentage of each type of projecting OXT neurons, which reside in the PT. |