
Fig. 1
- ID
- ZDB-FIG-150406-26
- Publication
- Boer et al., 2015 - Fascin1-Dependent Filopodia are Required for Directional Migration of a Subset of Neural Crest Cells
- Other Figures
- All Figure Page
- Back to All Figure Page
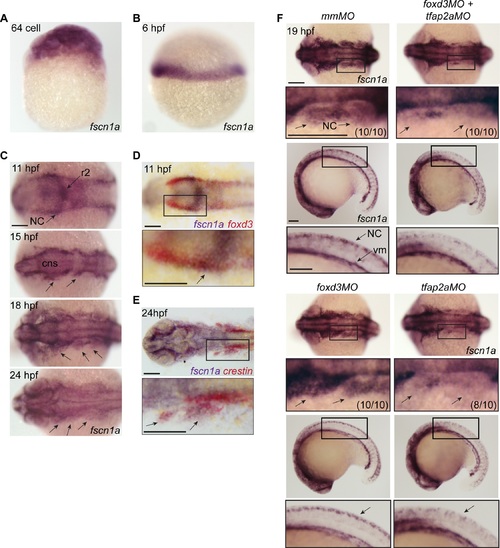
fscn1a mRNA expression in zebrafish NC is regulated by tfap2a. (A) Whole-mount ISH of maternal fscn1a mRNA at the 64-cell stage. (B) fscn1a mRNA expression at 6 hours post fertilization (hpf) at the gastrula margin. (C) Dorsal cranial views of fscn1a expression in 11, 15, 18, and 24 hpf embryos. 11 hpf embryos show expression in the brain, particularly rhombomere 2 (r2), and neural crest (NC) (top panel). In 15 and 18 hpf embryos, fscn1a is expressed in the brain (CNS) and cranial NC streams (middle panels, arrows). In 24 hpf embryos, fscn1a is expressed in the brain and pharyngeal arches (bottom panel, arrows). (D) In 11 hpf embryos, fscn1a mRNA is co-expressed with foxd3 at the neural plate border, highlighted in a magnified view (bottom panel). (E) fscn1a mRNA is co-expressed with crestin in cranial NC streams at 24 hpf, highlighted in a magnified view (bottom panel). (F) Dorsal cranial (top panels) and lateral (bottom panels) views of fscn1a expression in 19 hpf embryos injected with mismatch MO (mmMO), foxd3MO and tfap2aMO (foxd3MO+tfap2aMO), foxd3MO, or tfap2aMO. Magnified views of boxed regions are below each panel. Numbers in parentheses indicate proportion of embryos with phenotype. Scale bars = 100 µm. |
| Genes: | |
|---|---|
| Fish: | |
| Knockdown Reagents: | |
| Anatomical Terms: | |
| Stage Range: | 64-cell to Prim-5 |