
Fig. S1
- ID
- ZDB-FIG-150402-6
- Publication
- Kok et al., 2015 - Reverse Genetic Screening Reveals Poor Correlation between Morpholino-Induced and Mutant Phenotypes in Zebrafish
- Other Figures
- All Figure Page
- Back to All Figure Page
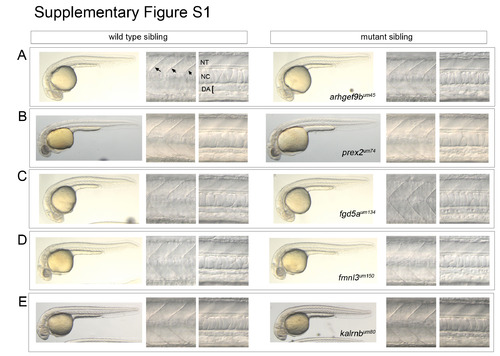
Related to Figure 2. General morphology in selected wild type and mutant sibling embryos. Whole embryos images (left panels in each set of images) were acquired using a standard dissection microscope. Images of somites (middle panels in each set; somite boundaries indicated by arrows in A) and dorsal aorta (DA; right panels in each set) were obtained using differential interference contrast (DIC) microscopy. Position of the neural tube (NT) and notochord (NC) are also noted in (A). All images are lateral views, dorsal is up, anterior to the left. (A) Wild type and arhgef9bum45 mutant sibling embryos. (B) Wild type and prex2um74 mutant sibling embryos. (C) Wild type and fgd5aum134 mutant sibling embryos. (D) Wild type and fmnl3um150 mutant sibling embryos. (E) Wild type and kalrnbum80 mutant sibling embryos. |
| Fish: | |
|---|---|
| Observed In: | |
| Stage: | Day 5 |
Reprinted from Developmental Cell, 32(1), Kok, F.O., Shin, M., Ni, C., Gupta, A., Grosse, A.S., van Impel, A., Kirchmaier, B.C., Peterson-Maduro, J., Kourkoulis, G., Male, I., DeSantis, D.F., Sheppard-Tindell, S., Ebarasi, L., Betsholtz, C., Schulte-Merker, S., Wolfe, S.A., Lawson, N.D., Reverse Genetic Screening Reveals Poor Correlation between Morpholino-Induced and Mutant Phenotypes in Zebrafish, 97-108, Copyright (2015) with permission from Elsevier. Full text @ Dev. Cell