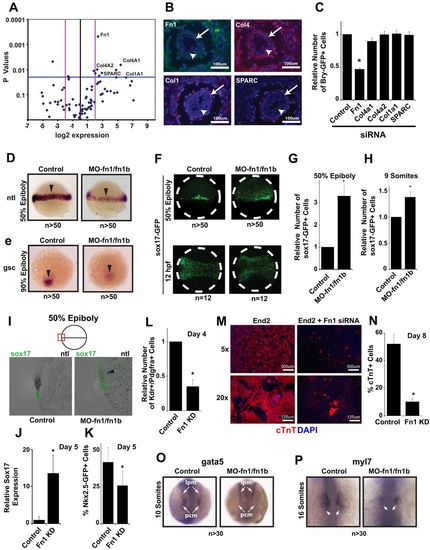
Fibronectin promotes End2-mediated induction of mesoderm and precardiac mesoderm in vitro and in vivo. (A) Volcano plot of an ECM expression array comparing End2 versus control cells. (B) Transverse sections of E6.5 mouse immunostained for Fn1, Col4, Col1 or Sparc. Arrows indicate visceral endoderm and arrowheads indicate epiblast. (C) Bry-GFP+ cells induced by co-culturing mESBry-GFP cells with End2 cells containing siRNA knockdown of Fn1, Col4a2, Col4a1, Col1a1 or Sparc. (D) ntl expression (arrowheads) examined by in situ hybridization in zebrafish embryos injected with control or fn1/fn1b morpholinos (MO-fn1/1b) at mid-gastrulation (50% epiboly; dorsolateral view, animal pole on top). (E) gsc expression (arrowheads) examined by in situ hybridization in zebrafish embryos injected with control or MO-fn1/1b at late gastrulation (90% epiboly; dorsal view, animal pole on top). (F) GFP expression in transgenic sox17-GFP zebrafish embryos injected with control or MO-fn1/1b at 50% epiboly (5.5 hpf; dorsal view, animal pole to the top) and at the 9-somite stage (12 hpf; dorsal view, anterior to the left). The dashed line indicates embryo border. (G) Relative number of sox17-GFP+ cells at 50% epiboly (5.5 hpf) in control or MO-fn1/1b-injected zebrafish embryos. (H) Relative number of sox17-GFP+ cells at the 9-somite stage (12 hpf) in control or MO-fn1/1b-injected zebrafish embryos. (I) Sagittal section of control or MO-fn1/1b morphant sox17-GFP zebrafish embryos at 50% epiboly (5.5 hpf) after in situ hybridization for expression of ntl (black); immunofluorescence indicates sox17-GFP+ cells in the ntl expression domain after fn1/1b knockdown. (J) Relative level of Sox17 mRNA in mES cells co-cultured with control or Fn1-deficient End2 cells. (K) Percentage GFP+ cells induced in mESNkx2.5-GFP cells at day 6 by co-culture with control or Fn1-deficient End2 cells. (L) Relative number of Kdr+ Pdgfrα+ precardiac mesoderm cells induced at day 4 by control or Fn1-deficient End2 cells. (M) cTnT and DAPI (nuclei) staining of day-8 replated Bry-GFP+ mesoderm isolated from co-culture of mESBry-GFP cells with control End2 or Fn1-deficient End2 cells at day 4. (N) Percentage of cTnT+ cells in M quantified by FACS. (O) Dorsal views of gata5 expression in zebrafish embryos at the 10-somite stage, assayed by in situ hybridization after control or fn1/1b knockdown. pcm, pre-cardiac mesoderm; lpm, lateral plate mesoderm. (P) Dorsal views of myl7 expression in zebrafish embryos at the 16-somite stage, assayed by in situ hybridization after control or fn1/1b knockdown. Cardiac progenitors are indicated by arrows. *P<0.05, ne5. Error bars indicate s.e. of biological replicates. KD, knockdown.
|
