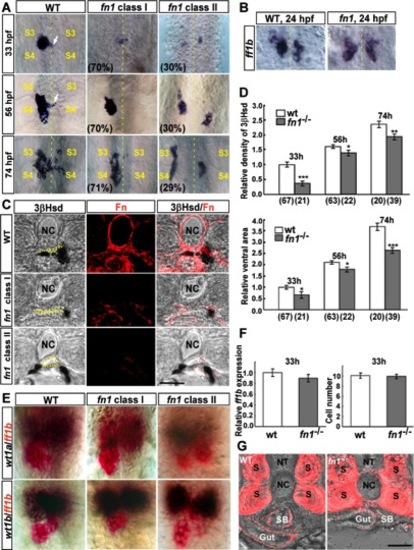
The analysis of interrenal morphogenesis in the fn1 mutant. A: Morphogenetic movements of the steroidogenic interrenal tissue in the fn1 mutant (fn1) and its wild type siblings (WT) at 33, 56, and 74 hpf were detected by whole-mount 3β-Hsd staining. Ventral flat-mount views of deyolked samples showed that the steroidogenic interrenal tissue appeared as a single aggregated cell cluster in the wild-type embryo, with the medially-migrating cells forming a protruding extension (white arrows) evident as early as 33 hpf, at the level between the third (S3) and fourth (S4) somites, which was extended across the midline (yellow dotted lines) by 56 hpf and became more loosely associated at 74 hpf. The medial extension and dispersion of single interrenal cell cluster was defective in the class I fn1 mutant, while the class II mutant displayed a more severe phenotype where bilateral interrenal primordia did not converge. B: Bilateral interrenal clusters expressing ff1b transcripts were detected in both the fn1 mutant and its wild-type sibling at the stage of 24 hpf, as assayed by an ISH analysis. C: The interrenal migration phenotype of the fn1 mutant at 72 hpf, which displayed disrupted Fn expression (red), was further demonstrated by vibratome sections with the dorsal side oriented toward the top. The lumen of the DA is marked by yellow dots. D: Relative density (top chart) and area (bottom chart) of steroidogenic interrenal tissues as assessed by 3βHsd activity staining from the ventral surface, in the fn1 mutant compared with its wild-type sibling control. The number of embryos for each population is indicated in parentheses. Both density and area of 3βHsd activity-positive interrenal cells were mildly yet significantly reduced in the fn1 mutant. *P < 0.05; **P < 0.005; ***P < 10−5. E: Double ISH assays showing the colocalization of ff1b (red) with wt1a and wt1b (dark brown), respectively, at 33 hpf in the fn1 mutant as well as its wild-type sibling. F: The Fast Red fluorescent intensity of ff1b ISH signals, and the number of ff1b-expressing interrenal cells as measured from the ventral surface, are quantified in left and right charts, respectively. Expression levels of ff1b transcripts, as well as the number of ff1b-expressing interrenal cells, are essentially invariable between the fn1 mutant (n = 25) and its wildtype siblings (n = 18) at the early stage of interrenal differentiation. G: The morphology of the developing gut tube in the fn1 mutant. Vibratome sections at the level of anterior gut region in the fn1 mutant (fn1-/-) as well as its wild-type sibling (WT) were stained with the antibody against Acta2 for demarcating smooth muscle cells located at the outer layers of gut tube (Gut) and swim bladder (SB), while the antibody also detected myofibrils at the somites (S). Morphology but not laterality of the gut tube is affected in the absence of Fn. NT, neural tube. NC, notochord. Scale bar = 50 μM.
|
