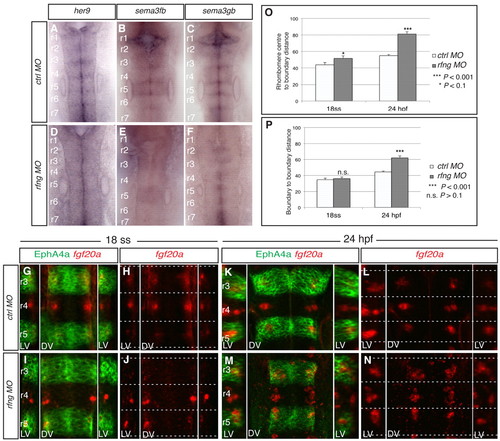
Disruption of all rhombomere boundaries leads to spreading of fgf20a neurons. (A-F) Expression of her9 (A,D), sema3fb (B,E) and sema3gb (C,F) in 24-hpf zebrafish embryos following injection of control MO (A-C) or rfng MO (D-F). rfng knockdown leads to loss of these markers at hindbrain boundaries (100%, n=14; 94%, n=16; 93%, n=15, respectively). (G-N) Expression of fgf20a mRNA (red) and EphA4a protein (green) at 18 ss (G-J) and 24 hpf (K-N) in control MO embryos (G,H,K,N) and rfng MO embryos (I,J,M,N). rfng knockdown has little effect on the organisation of fgf20a neurons at 18 ss (100%, n=8), but a strong effect at 24 hpf (90%, n=18). Dashed white lines indicate the position of segment borders. Left and right reconstructed lateral views (LV) and dorsal views (DV) are shown. (O) The average distance from fgf20 neuronal cluster edge to boundary. y-axis represents the distance from the rhombomere centre (0) to the boundary (100 arbitrary units, A.U.). For control MO the average distance from centre to cluster edge at 18 ss is 43.8±2.8 A.U. (n=15) and at 24 hpf is 54.9±1.5 A.U. (n=48). For rfng MO the distance at 18 ss is 51.8±2.8 A.U. (n=30; P=0.09) and at 24 hpf is 81.2±2.6 A.U. (n=48; P=9.4×10⁻¹⁶). On average, clusters in rfng morphants are 18% closer to boundaries than in controls at 18 ss, which increases significantly to a difference of 48% by 24 hpf. (P) Average anteroposterior (AP) length of fgf20 neuronal clusters. y-axis represents the distance from one rhombomere boundary (0) to another boundary (100 A.U.). For control MO at 18 ss the distance is 34.8±1.9 A.U. (n=15) and at 24 hpf is 44.6±0.9 A.U. (n=48). For rfng MO embryos the average length at 18 ss is 36.1±1.9 A.U. (n=30; P=0.67) and at 24 hpf is 62.1±2.4 A.U. (n=29; P=4.4×10⁻⁷). At 18 ss the difference is not significant, whereas at 24 hpf there is a significant 39% increase in length compared with control embryos. Values are average ± s.e.m. The orientation of embryos is as in Fig. 1.
|
