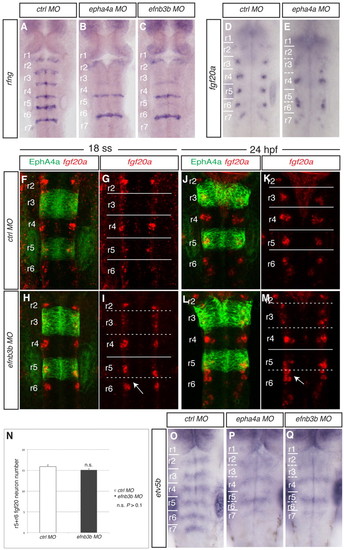
Disruption of a subset of rhombomere boundaries affects the position of fgf20a neurons. Brightfield and confocal images show dorsal views of the zebrafish hindbrain, anterior to the top, following in situ hybridisation (blue or red) and staining for EphA4 protein (green). (A-C) rfng expression in 21 ss embryos after injection of control MO (A), epha4a MO (B) or efnb3b-SB MO (C). There is decreased boundary marker expression selectively at the r2/r3, r3/r4 and r5/r6 borders following epha4a (90%, n=32) or efnb3b (82%, n=23) knockdown. (D,E) fgf20a expression at 24 hpf after injection of control MO (D) or epha4a MO (E). Knockdown of epha4a leads to altered localisation of fgf20a neurons (88%, n=26). (F-M) fgf20a expression (red) and EphA4 antibody staining (green) in embryos injected with control MO (F,G,J,K) or efnb3b-SB MO (H,I,L,M) at 18 ss (F-I) and 24 hpf (J-M). Arrow points to r5 and r6 fgf20a neuronal clusters that approach and fuse near to the r5/r6 interface. efnb3b morphants do not have the r5-r6 fusion of fgf20a neurons at 18 ss (95%, n=20), but do at 24 hpf (83%, n=18). (N) Quantitation of the number of fgf20a neurons in r5 plus r6. There is no significant difference between control versus efnb3b knockdown embryos (15.9±0.4 versus 15.1±0.3 neurons, average ± s.e.m., n=11 each; P=0.19). (O-Q) etv5b expression at 30 hpf in embryos injected with control MO (O), epha4a MO (P) and efnb3b-SB MO (Q). Knockdown of epha4a or efnb3b leads to an altered pattern with fewer stripes of etv5b expression (94%, n=35; 88%, n=24, respectively). Dashed white lines indicate the position of missing boundary marker expression, and continuous white lines indicate the position of remaining boundary cells. r, rhombomere.
|
