
Fig. 7
- ID
- ZDB-FIG-111025-49
- Publication
- Sun et al., 2007 - Epibranchial and otic placodes are induced by a common Fgf signal, but their subsequent development is independent
- Other Figures
- All Figure Page
- Back to All Figure Page
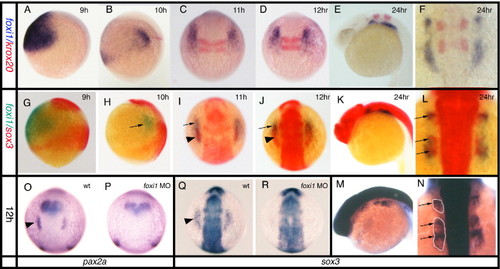
Relationship between foxi1 and sox3 expression. All panels viewed dorsally at the level of the hindbrain with rostral to the top, except (A, B, E, G, H, K, M) which are viewed laterally. (A, B, G, H) dorsal to the right, (E, K, M) rostral to left. (A–F) Double in situ hybridization for foxi1 (blue) expression illustrating its changing expression in relation to krox20 (red) which marks rhombomeres 3 and 5 in the hindbrain as a positional point of reference. foxi1 expression develops from a single large domain either side of the hindbrain (A), gradually elongating and finally separating into almost distinct patches but always extending from a position slightly rostral to a position slightly caudal to rhombomeres 2–5 (B–F). However, from early somite stages (B) onwards, the level of expression decreases in the more caudal and lateral regions with strong expression maintained only in the rostral-most region (this is particularly evident in panels (I, J)). (G–L) Double in situ hybridization for sox3 (red) and foxi1 (green). (M, N) Single in situ hybridization for sox3 (blue). foxi1 expression outside of the CNS precedes placodal sox3 expression which only appears at tailbud/early somite stages (G–I). Prior to this stage, foxi1 exists as a shrinking domain either side of the hindbrain that does not directly abut the CNS expression of sox3 (G, H). As sox3 expression appears within the larger foxi1 domain of expression, there is a concomitant down regulation of foxi1 in the region of overlap (G, H). This is less apparent in (C, D) since in situ hybridization for foxi1 has been overdeveloped to reveal its full domain of expression. At later stages (K–N) the domains of sox3 and foxi1 remain overlapping with the same rostrocaudal pattern, although the sox3 expression lies more medially and the foxi1 extends more laterally. Note that at 24 hpf expression of sox3 in the underlying endoderm is seen as a particularly dark stain (arrows) below the more diffuse patches of ectodermal expression (outlined in panel N) when viewed dosally (L, N). (O–R) Effects of foxi1 morpholino. In situ hybridization at 12 hpf shows placodal expression of pax2a (O) and sox3 (Q) in wildtype embryos (arrowheads), is lost in embryos injected with the foxi1 morpholino, (P) and (R) respectively. |
| Genes: | |
|---|---|
| Fish: | |
| Knockdown Reagent: | |
| Anatomical Terms: | |
| Stage Range: | 90%-epiboly to Prim-5 |
| Fish: | |
|---|---|
| Knockdown Reagent: | |
| Observed In: | |
| Stage: | 5-9 somites |
Reprinted from Developmental Biology, 303(2), Sun, S.K., Dee, C.T., Tripathi, V.B., Rengifo, A., Hirst, C.S., and Scotting, P.J., Epibranchial and otic placodes are induced by a common Fgf signal, but their subsequent development is independent, 675-686, Copyright (2007) with permission from Elsevier. Full text @ Dev. Biol.