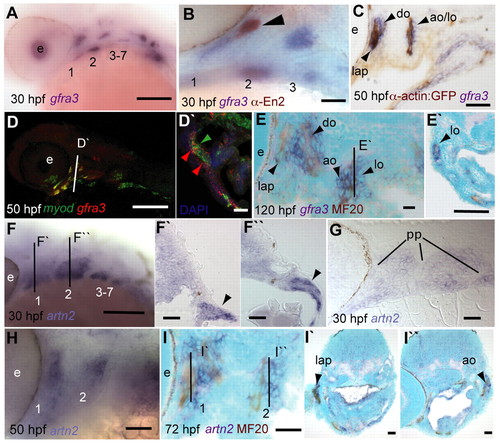
gfra3 and artn2 show tissue-specific expression in an opercular complex. (A,B) gfra3 (purple) is expressed in pharyngeal mesoderm at 30 hours post-fertilisation (hpf; A) and in muscle precursors (arrowhead) with En2 (brown, B). (C) At 50 hpf, gfra3 is expressed in forming muscle fibres expressing GFP (brown) in alpha-actin:GFP animals and associated cells. (D,D′) Fluorescent in situ of myod (green) and gfra3 (red) reveals colocalisation (yellow) in all forming pharyngeal arch muscles, but not in fin or ocular muscles. A transverse section (indicated by the line in D) through the second arch reveals gfra3 expression in myod- cells (D′). Red and green arrowheads indicate gfra3+myod– and gfra3+myod+ cells, respectively. (E,E′) At stages when primary muscle fibres have formed (120 hpf), sagittal sections show that gfra3 is expressed in mesenchymal cells adjacent to muscle fibres (brown, E) that completely surround the forming lo muscle (E′). Line in E indicates level of section in E′. (F-I′′) In situ hybridisation shows that artn2 is expressed in mesenchyme of the pharyngeal arches from 30 hpf. Transverse (F′,F′′) and sagittal (G) sections of the arches (1,2), reveal that artn2 expression is restricted to mesenchymal cells (arrowheads) and is excluded from the pharyngeal pouches (pp). Subsequently, artn2 becomes restricted to discrete domains in the dorsal first and second arches at 50 hpf (H). Sagittal (I) and transverse (I′,I*) sections reveal that as muscle fibres form (brown), artn2 expression is adjacent to the forming opercular muscles. Lines in I indicate level of sections in I′ and I*. Pharyngeal arches 1-7 are shown by numbering. ao, adductor operculi; do, dilator operculi; e, eye; lap, levator arcus palatini; lo, levator operculi. Scale bars: 100 μm in A,D,E′,F,I′,I* 20 μm in B,C,D′,E,F′-I.
|
