
Fig. 6
- ID
- ZDB-FIG-101208-15
- Publication
- Gorsi et al., 2010 - Dynamic expression patterns of 6-O endosulfatases during zebrafish development suggest a subfunctionalisation event for sulf2
- Other Figures
- All Figure Page
- Back to All Figure Page
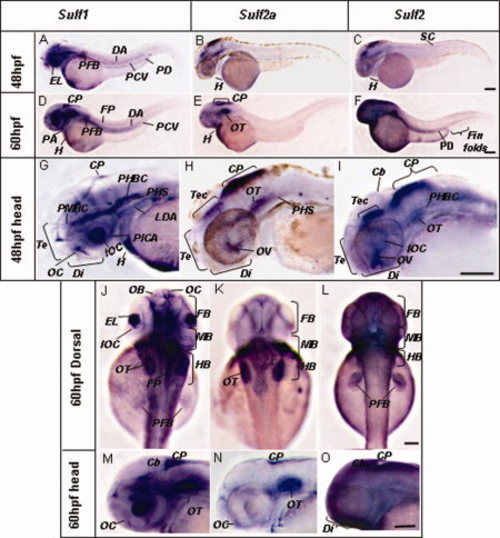
Expression of sulfs during the long-pec and pec fin stage. Expression of sulf1 at 48hpf whole shot; arrow denotes caudal fin folds (A) and lateral view of head (G), whole shot of embryo at 60hpf (D), lateral head (M), and dorsal view (J). Expression of sulf2a at 48hpf whole shot (B) and lateral view of head (H), whole shot of embryo at 60hpf (E), lateral head (N), and dorsal view (K). Expression of sulf2 at 48hpf whole shot (C) and lateral view of head (I), whole shot of embryo at 60hpf (F), lateral head (O), and dorsal view (L). Cb, cerebellum; CP; choroid plexus; DA, dorsal aorta; Di, diencephalon; E, eye; EL, eye lens; FB, forebrain; FP, floorplate; H, heart; HB, hindbrain; IOC, inner optic circle; LDA, lateral dorsal aorta; MB, midbrain; OB, olfactory bulb; OC, oral cavity; OT, otic vesicle; PA, pharyngeal arch; PCV, posterior cardinal vein; PD, pronephric ducts; PFB, pectoral finbuds; PHBC, primordial hindbrain channel; PHS, primary head sinus; SB, somite boundaries; SC, spinal cord; Te, telencephalon; Teg, tegmentum. Scale bar = 200 μm. |