
Fig. 5
- ID
- ZDB-FIG-101208-13
- Publication
- Gorsi et al., 2010 - Dynamic expression patterns of 6-O endosulfatases during zebrafish development suggest a subfunctionalisation event for sulf2
- Other Figures
- All Figure Page
- Back to All Figure Page
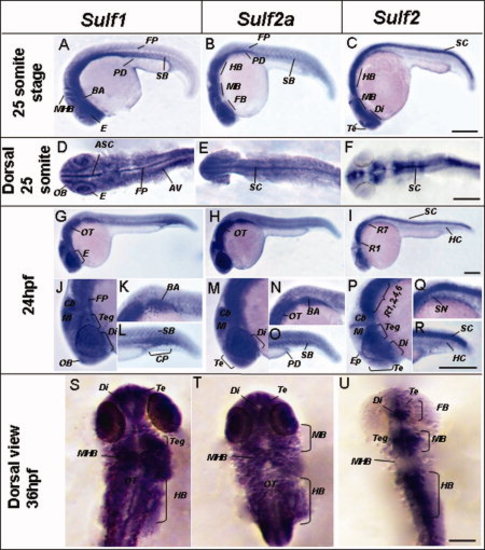
Expression of sulfs during segmentation and pharyngula period. Expression of sulf1 at 25-somite stage, lateral (A) and dorsal view (D); lateral view at 24hpf (G); close up of head, anterior trunk, and tail (J–L); and 36hpf dorsal view (S). Expression of sulf2a at 25-somite stage, lateral (B) and dorsal view (E); lateral view at 24hpf (H); close up of head, anterior trunk, and tail (M–O); and 36hpf dorsal view (T). Expression of sulf2 at 25-somite stage, lateral (C) and dorsal view (F); lateral view at 24hpf (I); close up of head, anterior trunk, and tail (P–R); and 36hpf dorsal view (U). ASC, anterior spinal cord; AV, axial vessels; BA, branchial arches; Cb, cerebellum; CP; caudal plexus; Di, diencephalon; E, eye; Ep, epiphysis; FB, forebrain; FP, floorplate; HB, hindbrain; HC, hypochord; M, mesencephalon; MHB, mid-hindbrain; OB, olfactory bulb; OT, otic vesicle; PD, pronephric ducts; R, rhombomeres; SB, somite boundaries; SC, spinal cord; SN; spinal cord neurons; Te, telencephalon; Teg, tegmentum. Scale bar = 200 μm. |