|
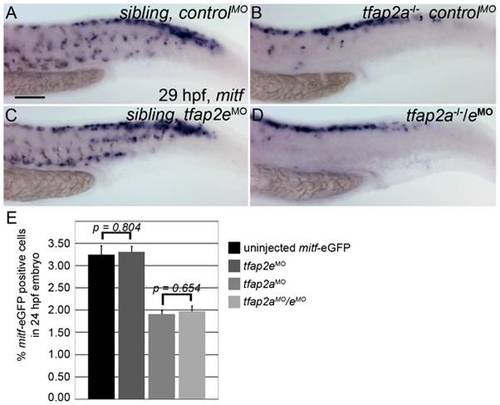
Numbers of mitfa-expressing cells are equivalent in tfap2a/e doubly-deficient and tfap2a deficient embryos. (A–D) Lateral trunk views of 29 hpf embryos of the indicated genotypes, injected with either control MO or tfap2e e3i3 MO, as indicated, and processed to reveal mitfa expression. Relative to the sibling embryo shown in (A), the tfap2a-/- mutant embryo injected with a control MO (B) clearly has fewer cells expressing mitfa. (C) A tfap2eMO injected sibling embryo, with normal number of Imitfa expressing cell numbers. (D) A tfap2a-/-/eMO embryo. The number of mitfa expressing cells is similar to that seen in tfap2a-/- mutants (N = 10 embryos, tfap2a-/- 287.2±5.8, tfap2a-/-/eMO 275.4±6.1, p = 0.18). The loss of mitf-expressing cells in tfap2a-/- and tfap2a-/-/eMO embryos is particularly prominent in the ventral portion of the tail. (E) Counts of GFP-expressing cells, scored by FACS, in dissociated 24 hpf mitfa:GFP transgenic embryos that were uninjected, injected with tfap2a MO, tfap2eMO, or tfap2a/eMO, as indicated. Numbers indicate the average (±SE) percentage of the GFP-expressing cells at 24 hpf; p values from a Student t-test are indicated. Bars one and two compare the percentage of mitfa-EGFP-positive cells from 24 hpf uninjected mitfa-EGFP transgenic embryos (n>50 embryos, 3 independent repeats) and 24 hpf tfap2eMO embryos (n>50 embryos, 3 independent repeats). Bars three and four compare the percentage of mitfa-EGFP-positive cells from 24 hpf tfap2aMO embryos (n>50 embryos, 3 independent repeats) and 24 hpf tfap2aMO/eMO embryos (n>50 embryos, 3 independent repeats). Student t-test analysis indicates that there is no significant difference between the numbers of mitfa-EGFP-positive cells in tfap2a-deficient embryos and tfap2a/e-deficient embryos (p = 0.65). (A) Scale bar, 100 μm, applies to all panels.
|