
Fig. 3
- ID
- ZDB-FIG-101012-52
- Publication
- Van Otterloo et al., 2010 - Differentiation of zebrafish melanophores depends on transcription factors AP2 alpha and AP2 epsilon
- Other Figures
- All Figure Page
- Back to All Figure Page
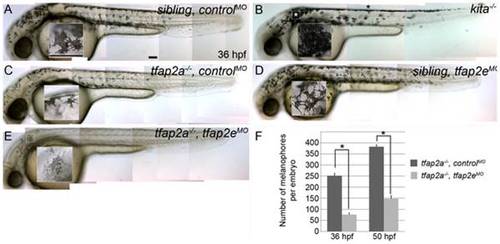
tfap2e morpholino has no effect in wild-type embryos, but disrupts melanophore differentiation in tfap2a mutants. (A–E) Lateral views of live embryos at 36 hpf. (A) A sibling embryo injected with a negative control MO (controlMO), with normal melanophores. (B) A kitab5 homozygous mutant, in which melanophores remain in the trunk dorsum (black asterisk) and near the otic vesicle (white asterisk), but are normally melanized. (C) A tfap2ats213 homozygous mutant injected with a control MO (tfap2a-/-,controlMO), exhibiting fewer melanophores than siblings and wild type embryos. (D) A sibling embryo injected with tfap2e e3i3 MO (tfap2eMO), with melanophores that are normal with respect to both number and differentiation. The pictured melanophore appears to be more spindly than control counterparts, but this was not a reproducible effect. (E) A tfap2e MO-injected, presumed tfap2a mutant embryo (tfap2a-/-/tfap2eMO), showing fewer melanin-producing melanophores than in tfap2a mutants (82 of 312 injected embryos from an incross of heterozygous tfap2a mutant fish resembled the pictured embryo). (F) Histogram presenting the average number (± standard error, SE) of pigmented melanophores per tfap2a-/-/controlMO and tfap2a-/-/tfap2eMO embryo at 36 hpf and 50 hpf. n = 10 embryos, asterisks indicate a p value <0.05. Scale bars: 100 μm. |
| Fish: | |
|---|---|
| Knockdown Reagents: | |
| Observed In: | |
| Stage: | Prim-25 |