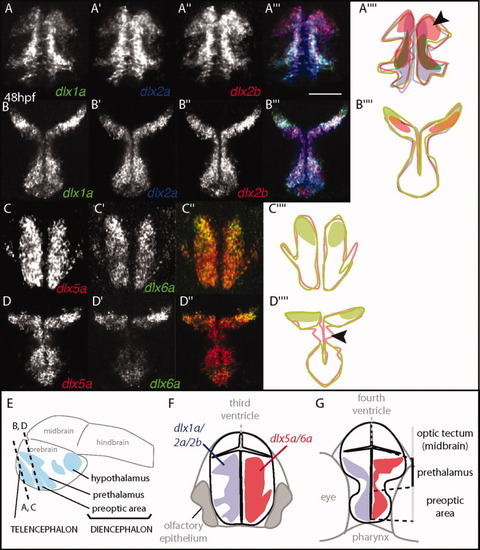
Similar forebrain expression of the two genes from a dlx cluster. A-D″: Single z transverse sections of triple fluorescent in situ hybridization shows dlx1a, dlx2a, and dlx2b expression domains at 48 hours postfertilization (hpf) in the telencephalon (A-A′″) and diencephalon (B,B′″), as well as dlx5a and dlx6a (C,C′″ and D-D′″). Schematic summaries representing the overlaps in dlx expression are shown in A″″, B″″, C″″, and D″″; the solid lines define the boundaries of detectable expression; the zones of relatively higher expression are colored when applicable. The boundaries of expression domains are comparable for dlx1a, dlx2a, and dlx2b, but dlx2b specifically displays a more intense zone of expression in a dorsal-lateral domain (arrow in A″″). Boundaries of expression domains for dlx5a and dlx6a are overall similar although dlx6a was hardly detected in the ventral domain of the prethalamus (arrowhead on D″″). E: Levels of section are shown on the schematic. Shared expression domains of clustered genes (and their paralogs) are mapped on a schematic representation of a brain section at the level of the telencephalon (F) and of the diencephalon (G): dlx1a/2a/2b in blue and dlx5a/6a in red. Scale bar = 100 μm.
|
