
Fig. S8
- ID
- ZDB-FIG-090501-72
- Publication
- de Pater et al., 2009 - Distinct phases of cardiomyocyte differentiation regulate growth of the zebrafish heart
- Other Figures
- All Figure Page
- Back to All Figure Page
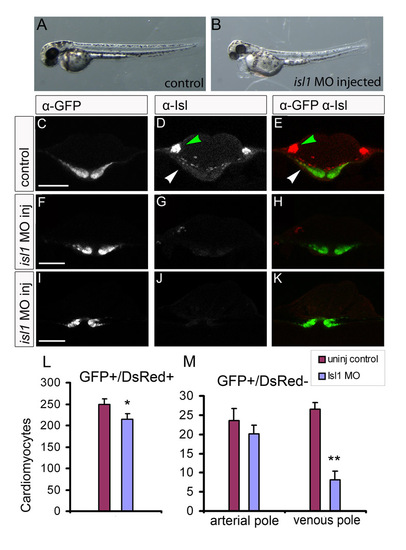
isl1 morpholinos reduce Isl1 protein and phenocopy the isl1 mutant in the developmental timing assay. (A,B) Live images of a representative control embryo and an embryo that was injected with the isl1 MO. isl1 morphants present with cardiac edema and loss of motility. (C-K) Single z-scans of confocal images of 23-somite stage Tg(cmlc2:eGFP) embryos after immunofluorescence staining with α-eGFP (C,F,I) and α-Isl (D,G,J) antibodies. (C-E) Control injected embryo; (F-H,I-K) examples of isl1 morphants. Arrowheads in the overlay of α-eGFP (green) with α-Isl (red) indicate the eGFPposIslpos cells in the cardiac disk. In the control (C-E), Isl is expressed in cardiac cells located at lateral positions in the cardiac disk (white arrowhead) and in the trigeminal sensory ganglion (green arrowhead), described in Fig. 3A-C. Note that the nuclear Isl signal in the cardiac disk in F-H and I-K is absent; however, some signal is still present in the trigeminal sensory ganglion in F-H. Scale bars: 80 μm. (L,M) The number of eGFPposDsRedpos (L) and eGFPposDsRedneg (M) cardiomyocytes/embryo. (M) The eGFPposDsRedneg cardiomyocytes are subdivided into those present at the arterial pole and those present at the venous pole. Note the significant reduction of eGFPposDsRedneg cells at the venous pole in the isl1 morphant embryos. Bars represent mean±s.e.m. *P<0.05; **P<0.01. |