
Fig. S3
- ID
- ZDB-FIG-080715-32
- Publication
- Liu et al., 2008 - In vivo time-lapse imaging delineates the zebrafish pituitary proopiomelanocortin lineage boundary regulated by FGF3 signal
- Other Figures
- All Figure Page
- Back to All Figure Page
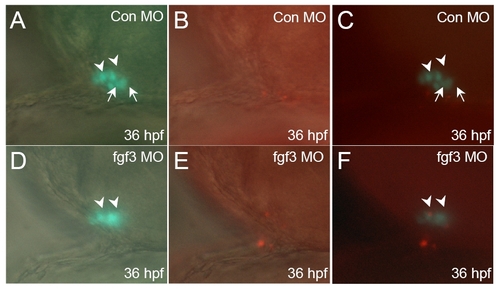
Hypomorphic fgf3 knock down do not inhibit POMC-GFP cell proliferation. Developmental stages are indicated at bottom right corner of each panel. (A-C) standard control MO injection. (D-F) fgf3 MO injection. DIC images of pituitary ventral-lateral views superimposed with fluorescent images of POMC-GFP expression (A and D), or BrdU immunostain in red (B and E). Fluorescent images of POMC-GFP superimposed with BrdU labeled cell in red show no inhibition of POMC-GFP cell proliferation in hypomorphic FGF3 morphants (F) compared with embryos injected with standard control MO (C) . Scale bar, 50 μm. All ventral-lateral view; top, anterior; right, dorsal; arrowhead: anterior-most POMC cells; arrow: lateral-posterior POMC cells. |
| Gene: | |
|---|---|
| Fish: | |
| Knockdown Reagent: | |
| Anatomical Term: | |
| Stage: | Prim-25 |
Reprinted from Developmental Biology, 319(2), Liu, N.A., Ren, M., Song, J., Ríos, Y., Wawrowsky, K., Ben-Shlomo, A., Lin, S., and Melmed, S., In vivo time-lapse imaging delineates the zebrafish pituitary proopiomelanocortin lineage boundary regulated by FGF3 signal, 192-200, Copyright (2008) with permission from Elsevier. Full text @ Dev. Biol.