
Fig. 7
- ID
- ZDB-FIG-070925-84
- Publication
- Clements et al., 2005 - LZIC regulates neuronal survival during zebrafish development
- Other Figures
- All Figure Page
- Back to All Figure Page
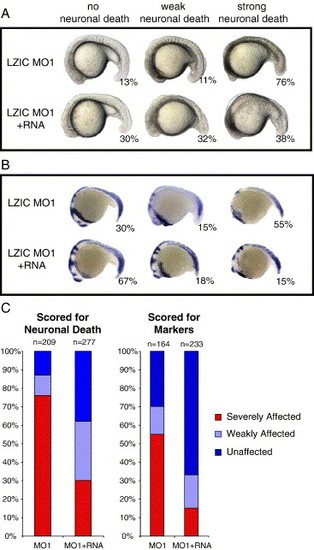
Rescue of lzic morphant phenotype by co-injection of lzic mRNA. Embryos were injected with either 10 ng LZIC MO1 alone or in combination with 250 pg HA-tagged lzic mRNA. (A) Representative embryos showing no visible neuronal death, weak death visible as tissue opacity, or strong death. The top row shows embryos injected with LZIC MO1 only (n = 209). The bottom row shows embryos injected with both LZIC MO1 and lzic mRNA (n = 277). Percentages of embryos in each class are given. (B) A subset of visually scored embryos was processed for in situ analysis using a cocktail of markers including ctsl, opl, en2, krox20, and myoD. Top row: LZIC MO1 alone (n = 164); bottom row: LZIC MO1 and lzic mRNA (n = 233). (C) Graphical representation of percentages of affected embryos in each class as scored visually (left graph) or by markers (right graph). Note that more LZIC MO1 was injected in these experiments than those in Fig. 4, Fig. 5 and Fig. 6 since the MO had become less effective by the time this experiment was performed. |
Reprinted from Developmental Biology, 283(2), Clements, W.K., and Kimelman, D., LZIC regulates neuronal survival during zebrafish development, 322-334, Copyright (2005) with permission from Elsevier. Full text @ Dev. Biol.