
Fig. 4
- ID
- ZDB-FIG-070925-81
- Publication
- Clements et al., 2005 - LZIC regulates neuronal survival during zebrafish development
- Other Figures
- All Figure Page
- Back to All Figure Page
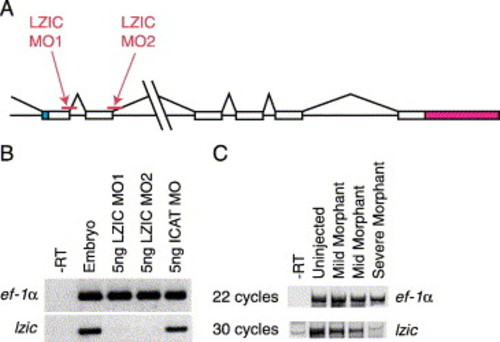
LZIC morpholinos specifically block expression of lzic. (A) Schematic of the genomic structure of lzic showing the relative locations of LZIC MO1 and LZIC MO2 (indicated). White, coding exons; blue, 5′ UTR; red, 3′ UTR. LZIC MO1 blocks the splice donor site at the first coding exon/intron boundary. LZIC MO2 blocks the splice donor site at the second coding exon/intron boundary. (B) Injection of LZIC MO1 or LZIC MO2 eliminates lzic message. 5 ng of LZIC morpholinos or a control morpholino was injected into 1–2 cell stage embryos as indicated above the figure. At tailbud stage, levels of lzic mRNA were analyzed by RT-PCR. LZIC morpholinos eliminated lzic, but not ef-1α. (C) LZIC message levels correlate with the severity of the phenotype. 3 ng LZIC MO1 was injected into embryos at the 1–2 cell stage. At 15 somites, fish were segregated into pools based on the severity of phenotype, and lzic expression was examined by RT-PCR. More severe embryos have less lzic mRNA. |
Reprinted from Developmental Biology, 283(2), Clements, W.K., and Kimelman, D., LZIC regulates neuronal survival during zebrafish development, 322-334, Copyright (2005) with permission from Elsevier. Full text @ Dev. Biol.