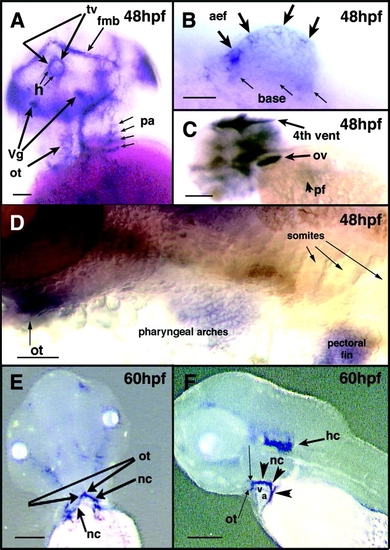
Whole-mount in situ hybridization: 48-60 hpf. A: Nearly ventral view, 48 hours postfertilization (hpf). Expression can be seen in tectal ventricle (tv), hypothalamus (h), trigeminal ganglia (Vg), and the forebrain-midbrain boundary (fmb). ot, cardiac outflow tract; pa, pharyngeal arches. B: High-magnification view of the pectoral fin shows predominance of transcripts at the apical ectodermal fold (aef, large arrows), although some expression can also be seen at the base (base, small arrows). C: Near-lateral view, 48 hpf. Intense expression is seen in the fourth ventricle (4th vent) and otic vesicle (ov), whereas comparatively low-level expression is seen in the pectoral fin (pf). D: Near-parasagittal section, 48 hpf. Cx43α is expressed in the pectoral fin bud mesenchyme, pharyngeal arches, and outflow tract (ot) of the heart. E,F: Ventral and lateral views, respectively, of 60 hpf embryo. In addition to the horizontal semicircular canal (hc) in the ear, transcripts are noted in the cardiac outflow tract (ot), ventricle (v), atrioventricular junction, and atrium (a), but not sinus venosus. The shape of this expression domain (arrowheads in F) conforms to that of neural crest (nc) cell migration along the dorsolateral aspects of the looped heart tube. Scale bars = 75 μm in A, 50 μm in B,D, 250 μm in C, 210 μm in E, 240 μm in F.
|
