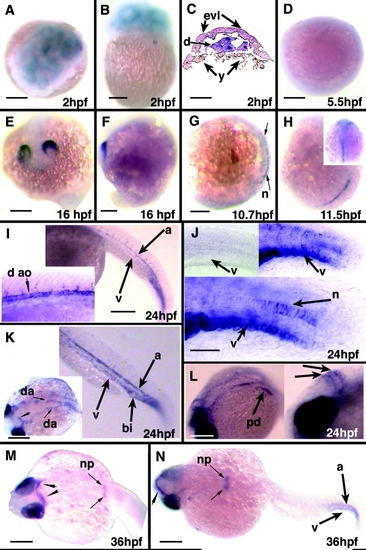
Whole-mount in situ hybridization, early stages. A: Animal pole view, 2 hours postfertilization (hpf), 64-cell stage. Maternal transcripts are evident in the deep cells, with little or no Cx43α expression in the enveloping layer. B: Lateral view of embryo shown in A. C: Sectioning of the same embryo confirms the localization of transcripts in deep cells (d). evl, enveloping layer; y, yolk. D: Shield stage (5.5 hpf), animal pole view. Maternal transcript has largely been extinguished. E,F: Anterior (rostral, E) and lateral (F) views of the 16 hpf, 14-somite stage embryo. The most prominent expression at this stage is in the retina. The tail is toward the bottom of these two panels and in G and H. G: Lateral view, 10.7 hpf, tail bud stage. The earliest domain of zygotic Cx43 expression is in the notochord (n, arrows). H: Oblique view, 11.5 hpf, five-somite stage. Peak notochord expression progresses in a rostrocaudal sequence. Same scale as G. Inset: dorsal view of the same embryo. I: Lateral view, 24 hpf embryo. Rostral is to the left in this panel and in J through N. Transcripts are noted in the wall of the trunk dorsal aorta (a) and axial vein (v). Inset: the sprouting intersomitic arteries also demonstrate expression, which extends to the level of the dorsolateral surface of the neural tube. d ao, dorsal aorta. J: Lateral view of the tail, 24 hpf. Notochord (n) expression can be detected in the distal tail. Inset: Near-parasagittal section reveals expression in the rostral (anterior) half of each somite (right inset). For comparison, hybridization with a Cx43 sense riboprobe is shown on the left inset (v, axial vein). K: Higher magnification lateral view, 24 hpf. The axial vein (v) expression appears to sidestep the ventral extent of the blood island (bi). The inset (dorsal view) shows that both dorsal aortae (da, proximal to their coalescence point) express Cx43α. The midbrain-hindbrain boundary region (small, unlabeled arrow) also appears to be a site of expression. L: Near-lateral views, 24 hpf. Left: In addition to the dorsal aortae, transcripts can also be identified in the pronephric ducts (pd). Right: Higher magnification view of the midbrain-hindbrain boundary region shows more clearly that the expression is actually on either side of the midbrain-hindbrain boundary. M,N: Dorsal views of the rostral and caudal embryo, 36 hpf. Cx43α expression is seen in the pronephric primordia (np) bilaterally. The midbrain-hindbrain boundary region continues to show intense expression (unlabeled arrows). a, caudal-most portion of aorta; v, axial vein. Scale bars = 175 μm in A,B,D,F, 160 μm in C,G (applies to H), 220 μm in E, 250 microns in I, 100 μm in J, 280 μm in K, 200 μm in L-N.
|
