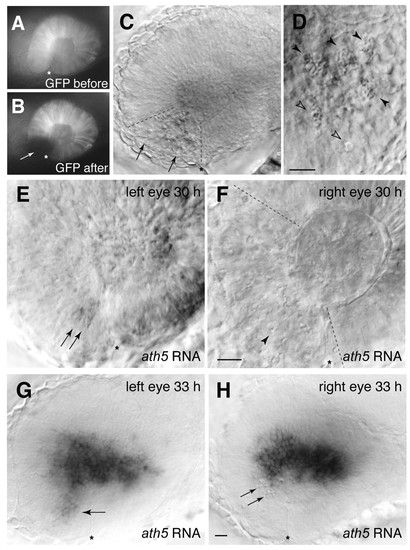
Laser ablation of the ventronasal retina does not block the spread of ath5 into the central retina. (A,B) Targeting of ventronasal retina for laser ablation. A single larva homozygous for the Pax6DF4:mGFPs220 transgene was photographed before (A) and immediately after (B) the ablation procedure. The laser-targeted region is no longer fluorescent (arrow). (C-F) Laser-targeting of ventronasal retina at 24 hpf efficiently kills cells and prevents ath5 expression. (C) Pyknotic nuclei (arrows) were visible using DIC illumination and were found specifically within the laser-targeted region (delineated with dashed lines in C,F). Higher magnification (D) shows the characteristic pyknotic morphology of the dying cells (closed arrowheads indicate clusters of pyknotic cells; open arrowheads indicate single pyknotic cells). (E-F) Untreated (E) and treated (F) eyes of the same larva sacrificed at 30 hpf and stained for ath5 RNA expression. The initial patch of 2-3 ath5+ cells is present in the control eye (E, arrows) but absent in the treated eye (F). The arrowhead in F indicates one example of a pyknotic cell in the laser-targeted region. (G,H) Preventing ventronasal ath5 expression has no effect on subsequent ath5 expression. Untreated (G) and treated (H) eyes of a single larva ablated at 24 hpf and stained for ath5 expression at 33 hpf. In the intact eye (G), ath5+ cells are seen in ventronasal retina (arrow), as well as nasal and central regions. In the treated eye, ventronasal ath5 expression is abolished and pyknotic nuclei are evident (arrows). Nevertheless, nasal and central retinal ath5 expression is normal. Nasal/anterior is to the left, dorsal is up, and an asterisk marks the location of choroid fissure in all panels. See Fig. S1 in the supplementary material for more examples. Scale bars: in D, 10 µm; in F, 25 µm for E,F; in H, 25 µm for C,G,H.
|
