
Fig. 5
- ID
- ZDB-FIG-050621-7
- Publication
- Kay et al., 2005 - Staggered cell-intrinsic timing of ath5 expression underlies the wave of ganglion cell neurogenesis in the zebrafish retina
- Other Figures
- All Figure Page
- Back to All Figure Page
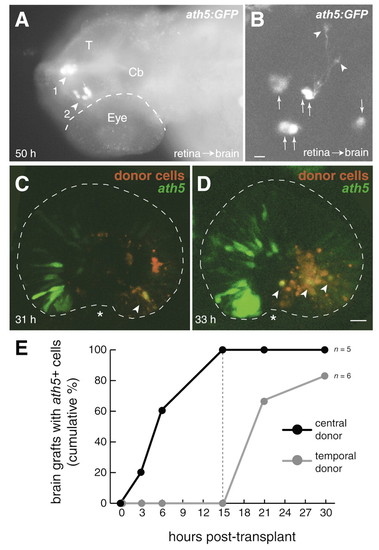
Retinal position cell-autonomously specifies timing of ath5 expression. (A,B) Retinal cells can express ath5 and form neurons in the absence of retinal signals. (A) Cells removed from the retina (before ath5 expression) and heterotopically transplanted into the head express ath5:GFP at 50 hpf. Dorsal view of fixed embryo immunostained for GFP. One cluster of GFP cells is at the dorsal midline, sitting between the epidermis and the tectum (arrowhead 1). The other GFP+ cluster is in the diencephalic ventricle (arrowhead 2). (B) Higher-magnification view of a different heterotopic retinoblast graft, located in the telencephalic ventricle. Single confocal scan taken from live fish at 50 hpf. Several cells express ath5:GFP (arrows). Some assume a morphology typical of RGCs, with growing axons tipped by growth cones (arrowheads). Anterior is left in both panels. Ventral is down in B. (C,D) Retinal signals cannot re-specify the timing of ath5 expression. Nasal donor retinoblasts (red) were grafted into temporal retina of an ath5:GFP transgenic host before onset of ath5 expression. Subsequently, when ath5 expression (green) had begun in host nasal retina, live hosts were imaged on a confocal microscope. Donor cells located ahead of the host′s ath5:GFP wave front expressed GFP (yellow cells; marked with arrowheads). Each image is a z-projection of a stack of confocal images. Asterisks mark choroid fissure. Nasal/anterior is left and dorsal up in both panels. (E) The relative timing of ath5 expression is maintained in the absence of retinal signals. Host embryos carrying either central or temporal retinal grafts in the brain ventricles were screened for ath5:GFP expression at various times post-transplant. The cumulative percentage of grafts expressing GFP was plotted for each time point. The central grafts (black line) expressed ath5:GFP before the temporal grafts (gray line). The dashed line indicates the time when all central grafts, but none of the temporal grafts, were GFP+. n=11 hosts (six temporal grafts and five central grafts). Scale bars: 5 µm in B; 25 µm in C,D. Cb, cerebellum; T, tectum. |