
- Title
-
chrna3 modulates alcohol response
- Authors
- Raine, J., Kibat, C., Banerjee, T.D., Monteiro, A., Mathuru, A.S.
- Source
- Full text @ J. Neurosci.
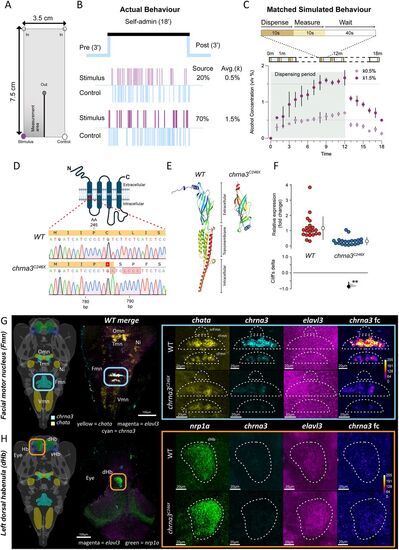
SAZA chamber functional design and characterization of the chrna3C246X mutant zebrafish. A, Schematic indicating locations of inflow of system water (In, top) and outflow (Out, center). Control and stimulus delivery inlets (stimulus shown in purple) are activated when a fish enters the corresponding zone. Continuous inflow and outflow constrain the stimulus/control delivered to their respective zones (Nathan et al., 2022). “Measurement area” denotes where alcohol concentration was measured in panel C. B, Schematic shows the experimental design with 3 min pre- and postexposure periods before and after an 18 min self-administration period. Representative sparkline plots show the entries and duration (thickness) of entry of the subject fish either into the stimulus or the control zones when 20 or 70% alcohol is used as stimuli. C, Alcohol concentrations measured when 20 or 70% alcohol were dispensed for the duration mimicking subject fish behavior (±standard error). The average concentration (solid line) fish experience is 0.5 and 1.5% alcohol, respectively. See Table 2 for additional details. D–H, Characterization of chrna3C246X mutant fish. D, chrna3C246X mutants have a premature stop codon in the transmembrane Region 1, amino acid 246 (M1 - red star), due to the indel of 5 bp at position 786 bp. E, Predicted protein structure of chrna3 in WT and chrna3C246X mutants, generated by iTasser (Zhou et al., 2022), color coded by domain. F, Fold change of chrna3 in 12-week-old WT (n = 21) versus chrna3C246X (n = 20) by qRT-PCR. G, H, chrna3 expression in 14-d-old zebrafish larvae visualized by Hybridisation Chain Reaction RNA-FISH (HCR) in the G. Predicted Fmn marked by chata expression and (H) dorsal habenula (dHb) marked by nrp1a expression, in WT and chrna3C246X, respectively. Images are representative; see Figures S1 and S2 for replicates (WT/chrna3C246X Fmn n = 3/4; dHb n = 4/3). Schematic images with regional markers (v2.0, MECE, 2024) were generated in mapZeBrain Atlas (mapzebrain.org, May 2025; Kunst et al., 2019). Hb, habenula; vHb, ventral habenula; Omn, oculomotor nucleus; Trm, trochlear motor nucleus; Ni, nucleus isthmi; Vmn, vagus motor nucleus; srFmn, suprarostral Fmn; rFmn, rostral Fmn; cFmn, caudal Fmn. Genes presented left to right: all genes merged, G. chata, or H, nrp1a, chrna3, elavl3, and chrna3 with false color postprocessing. False color is adjusted (fc), and elavl3 images have been brightened for enhanced visibility. |
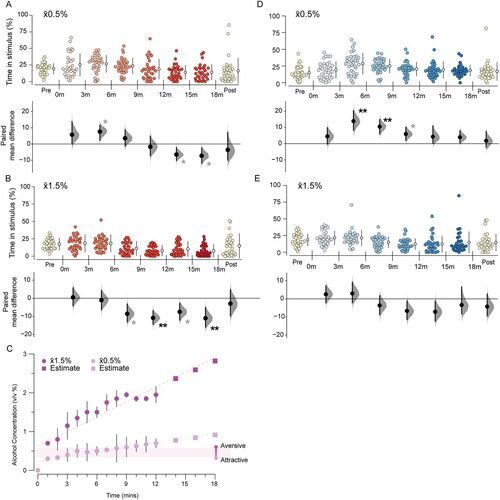
The preference for alcohol is biphasic. Gardner–Altman and Cumming estimation plots show alcohol response in 3 min intervals. No stimulus was dispensed in the “Pre” and “Post” periods. Time spent in the stimulus zone during x̄0.5% SAZA condition for A. WT (n = 31,) and D. chrna3C246X mutants (n = 32). Time spent in the stimulus zone in the x̄1.5% SAZA condition for B. WT (n = 30), and E. chrna3C246X mutants (n = 30). C, Ethanol concentrations in the stimulus zone in the x̄0.5% and x̄1.5% alcohol conditions and estimated for extended periods. The concentration at which attraction switches to aversion is highlighted. Asterisks indicate a significant paired mean difference between that time portion and the prestimulus period: *padj < 0.05 (provisional difference), **padj < 0.01 (meaningful difference). See Table S1 for the precise effect sizes and p values, corrected for multiple comparisons. |
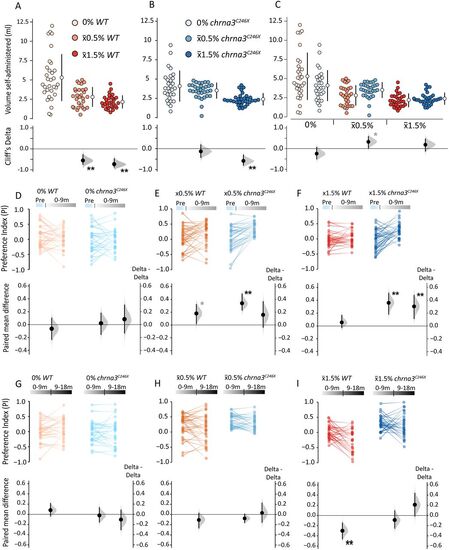
chrna3 mutation dynamically alters relative preference for alcohol. A–C, Gardner–Altman and Cumming estimation plots comparing the volume of alcohol dispensed over the entire self-administration period during SAZA for A, WT (0/x̄0.5/x̄1.5%, n = 30/31/30); B, chrna3C246X (0/x̄0.5/x̄1.5%, n = 29/32/30); and C, intergenotype comparisons. Asterisks indicate the following significant differences from 0% alcohol treatments (A, B) or the WT (C), *padj < 0.05, and the effect size reported by Cliff's delta between ±0.2 and ±0.4 (provisional difference), **padj < 0.01 and effect size bigger than ±0.4 (meaningful difference). D–I, Paired mean difference of PI between D and F. Pre and 0–9 m or G–I, 0–9 and 9–18 m time periods within genotypes and delta–delta comparisons between genotypes, during D and G, 0%; E and H, x̄0.5%; and F and I, x̄1.5% SAZA. Asterisks indicate a significant paired mean difference, or delta–delta, between time periods: *p < 0.05 (provisional difference); **p < 0.01 (meaningful difference). See Table S2 for the exact effect size and p values. |
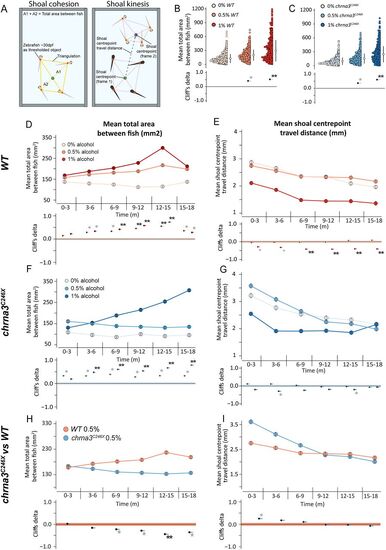
chrna3 mutants experience reduced psychoactive effects from alcohol exposure. A, A schematic outline of the shoaling assay metric calculation and processing steps for cohesion (shoal area) and kinesis (shoal movement). B and C, Gardner–Altman, or D, F, and H, mean (±95% CI) shoal cohesion, and E, G, and I, kinesis, with Cumming estimation plots for the shoaling cohesion assay showing B, D, and E, WT; C, F, and G, chrna3C246X; and H and I, intergenotype comparisons. Metrics recorded per frame at 2 fps (n = 6 assays per genotype, per treatment). Asterisks indicate a significant difference in the estimated marginal mean from B to G, 0% alcohol, or H and I, WT within that time period, *padj < 0.05, and the effect size reported by Cliff's delta between ±0.2 and ±0.4 (provisional difference), **padj < 0.01, and the effect size greater than ±0.4 (meaningful difference). See Table S3 for the exact effect size and p values. |
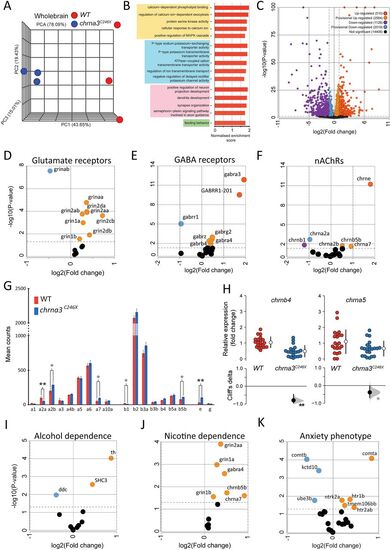
chrna3C246X mutants exhibit transcriptional changes in dependence, neuronal development, and ion channel process-associated genes. RNA-seq comparison of chrna3C246X (n = 3) versus chrna3C246X (n = 3) 12-week-old zebrafish whole-brain tissues. A, PCA clustering of samples by genotype. B, All significantly enriched GO terms between genotypes. Positive enrichment values indicate enrichment in the chrna3C246X mutant zebrafish. Significance thresholds are defined at p ≤ 0.05 and FDR < 0.2. Yellow, secondary messenger associated; blue, ion channel associated; pink, neuronal differentiation and development; green, behaviors. C, The volcano plot of gene expression changes between genotypes. Up-/downregulated genes, p < 0.05, and log2 fold change, > ± 2. Provisional up-/downregulated genes, p < 0.05, and log2 fold change, < ± 2. Not significant genes, p > 0.05. The color key applies to D–F and I–K. Positive fold change values indicate upregulation in the chrna3C246X mutant zebrafish. D–F, Subsets of the volcano plot (C), highlighting (D) glutamate, (E) GABA, and (F) nicotinic acetylcholine (nAChR) receptor gene families. G, Mean counts (±standard deviation) of nAChRs (gene prefix “chrn”). Stars indicate significant difference between genotypes, **p < 0.01; *p < 0.05. H, Fold change in WT versus chrna3C246X of chrna5 (n = 21/20) and chrnb4 (n = 22/22) by qRT-PCR. Stars indicate significant difference between genotypes, **p < 0.01; *p < 0.05. I–K, Subsets of a volcano plot (C), highlighting genes associated with (I) nicotine or (J) alcohol dependence (Hu et al., 2018) and (K) anxiety phenotypes (Howe et al., 2016; Koskinen and Hovatta, 2023). The full gene lists can be found in Table 4 |