
|
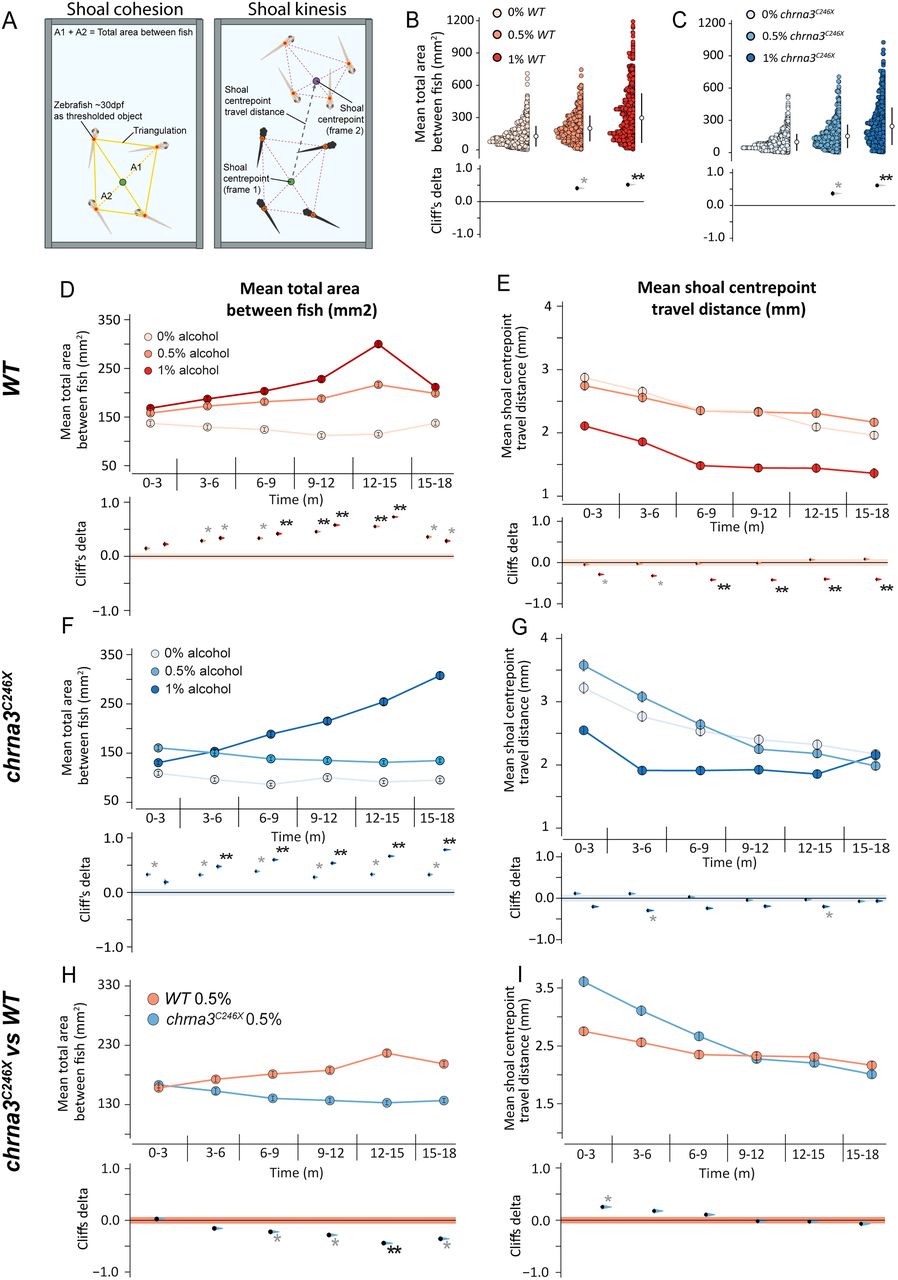
Fig. 4 chrna3 mutants experience reduced psychoactive effects from alcohol exposure. A, A schematic outline of the shoaling assay metric calculation and processing steps for cohesion (shoal area) and kinesis (shoal movement). B and C, Gardner–Altman, or D, F, and H, mean (±95% CI) shoal cohesion, and E, G, and I, kinesis, with Cumming estimation plots for the shoaling cohesion assay showing B, D, and E, WT; C, F, and G, chrna3C246X; and H and I, intergenotype comparisons. Metrics recorded per frame at 2 fps (n = 6 assays per genotype, per treatment). Asterisks indicate a significant difference in the estimated marginal mean from B to G, 0% alcohol, or H and I, WT within that time period, *padj < 0.05, and the effect size reported by Cliff's delta between ±0.2 and ±0.4 (provisional difference), **padj < 0.01, and the effect size greater than ±0.4 (meaningful difference). See Table S3 for the exact effect size and p values.