
Fig. 1
- ID
- ZDB-FIG-251106-8
- Publication
- Raine et al., 2025 - chrna3 modulates alcohol response
- Other Figures
- All Figure Page
- Back to All Figure Page
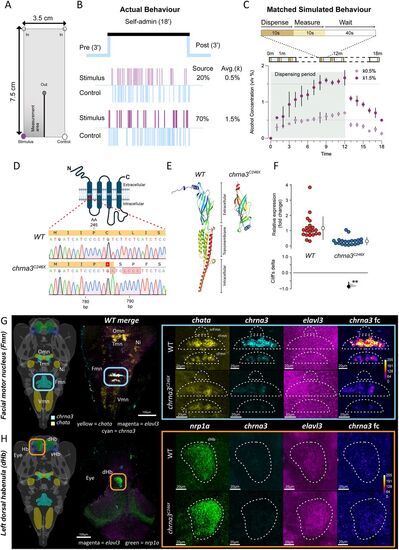
SAZA chamber functional design and characterization of the chrna3C246X mutant zebrafish. A, Schematic indicating locations of inflow of system water (In, top) and outflow (Out, center). Control and stimulus delivery inlets (stimulus shown in purple) are activated when a fish enters the corresponding zone. Continuous inflow and outflow constrain the stimulus/control delivered to their respective zones (Nathan et al., 2022). “Measurement area” denotes where alcohol concentration was measured in panel C. B, Schematic shows the experimental design with 3 min pre- and postexposure periods before and after an 18 min self-administration period. Representative sparkline plots show the entries and duration (thickness) of entry of the subject fish either into the stimulus or the control zones when 20 or 70% alcohol is used as stimuli. C, Alcohol concentrations measured when 20 or 70% alcohol were dispensed for the duration mimicking subject fish behavior (±standard error). The average concentration (solid line) fish experience is 0.5 and 1.5% alcohol, respectively. See Table 2 for additional details. D–H, Characterization of chrna3C246X mutant fish. D, chrna3C246X mutants have a premature stop codon in the transmembrane Region 1, amino acid 246 (M1 - red star), due to the indel of 5 bp at position 786 bp. E, Predicted protein structure of chrna3 in WT and chrna3C246X mutants, generated by iTasser (Zhou et al., 2022), color coded by domain. F, Fold change of chrna3 in 12-week-old WT (n = 21) versus chrna3C246X (n = 20) by qRT-PCR. G, H, chrna3 expression in 14-d-old zebrafish larvae visualized by Hybridisation Chain Reaction RNA-FISH (HCR) in the G. Predicted Fmn marked by chata expression and (H) dorsal habenula (dHb) marked by nrp1a expression, in WT and chrna3C246X, respectively. Images are representative; see Figures S1 and S2 for replicates (WT/chrna3C246X Fmn n = 3/4; dHb n = 4/3). Schematic images with regional markers (v2.0, MECE, 2024) were generated in mapZeBrain Atlas (mapzebrain.org, May 2025; Kunst et al., 2019). Hb, habenula; vHb, ventral habenula; Omn, oculomotor nucleus; Trm, trochlear motor nucleus; Ni, nucleus isthmi; Vmn, vagus motor nucleus; srFmn, suprarostral Fmn; rFmn, rostral Fmn; cFmn, caudal Fmn. Genes presented left to right: all genes merged, G. chata, or H, nrp1a, chrna3, elavl3, and chrna3 with false color postprocessing. False color is adjusted (fc), and elavl3 images have been brightened for enhanced visibility. |