
Fig. 3
- ID
- ZDB-FIG-251106-10
- Publication
- Raine et al., 2025 - chrna3 modulates alcohol response
- Other Figures
- All Figure Page
- Back to All Figure Page
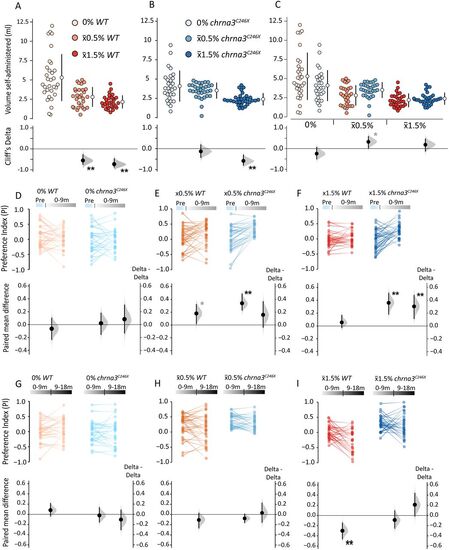
chrna3 mutation dynamically alters relative preference for alcohol. A–C, Gardner–Altman and Cumming estimation plots comparing the volume of alcohol dispensed over the entire self-administration period during SAZA for A, WT (0/x̄0.5/x̄1.5%, n = 30/31/30); B, chrna3C246X (0/x̄0.5/x̄1.5%, n = 29/32/30); and C, intergenotype comparisons. Asterisks indicate the following significant differences from 0% alcohol treatments (A, B) or the WT (C), *padj < 0.05, and the effect size reported by Cliff's delta between ±0.2 and ±0.4 (provisional difference), **padj < 0.01 and effect size bigger than ±0.4 (meaningful difference). D–I, Paired mean difference of PI between D and F. Pre and 0–9 m or G–I, 0–9 and 9–18 m time periods within genotypes and delta–delta comparisons between genotypes, during D and G, 0%; E and H, x̄0.5%; and F and I, x̄1.5% SAZA. Asterisks indicate a significant paired mean difference, or delta–delta, between time periods: *p < 0.05 (provisional difference); **p < 0.01 (meaningful difference). See Table S2 for the exact effect size and p values. |