
Fig. 2
- ID
- ZDB-FIG-251106-9
- Publication
- Raine et al., 2025 - chrna3 modulates alcohol response
- Other Figures
- All Figure Page
- Back to All Figure Page
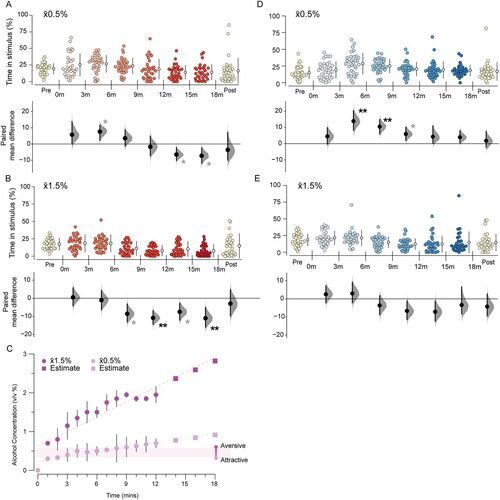
The preference for alcohol is biphasic. Gardner–Altman and Cumming estimation plots show alcohol response in 3 min intervals. No stimulus was dispensed in the “Pre” and “Post” periods. Time spent in the stimulus zone during x̄0.5% SAZA condition for A. WT (n = 31,) and D. chrna3C246X mutants (n = 32). Time spent in the stimulus zone in the x̄1.5% SAZA condition for B. WT (n = 30), and E. chrna3C246X mutants (n = 30). C, Ethanol concentrations in the stimulus zone in the x̄0.5% and x̄1.5% alcohol conditions and estimated for extended periods. The concentration at which attraction switches to aversion is highlighted. Asterisks indicate a significant paired mean difference between that time portion and the prestimulus period: *padj < 0.05 (provisional difference), **padj < 0.01 (meaningful difference). See Table S1 for the precise effect sizes and p values, corrected for multiple comparisons. |