
- Title
-
Toxicological effects of ADB-FUBINACA on early zebrafish development: An analysis utilizing metabolomics
- Authors
- Luo, Y., Ying, L., Liu, Y., Fan, Y., Wang, K., Lan, Y., Chian, S.
- Source
- Full text @ Ecotoxicol. Environ. Saf.
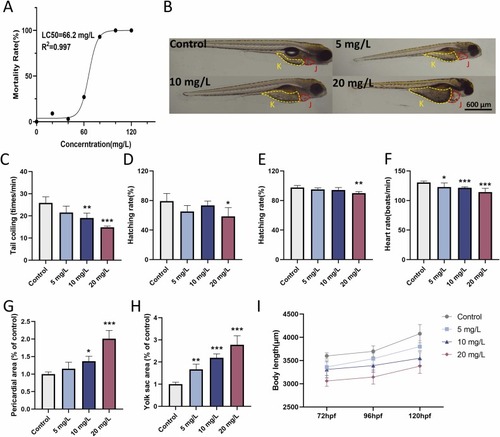
The impact of ADB-FUBINACA exposure on the developmental toxicity of zebrafish embryos. (A) The mortality rates. (B) Representative embryo images at 120 hpf, which shows that " J " and " K " represent the heart and yolk sac respectively. (C) Tail coiling frequency at 24 hpf. (D) Hatching rate at 48 hpf. (E) Hatching rate at 72 hpf. (F) Heart rate at 120 hpf. (G) The area of pericardial at 120 hpf. (H) Yolk sac area at 120 hpf. (I) Body length at 72, 96, and 120 hpf with ADB-FUBINACA exposure. The data were presented as mean ± S.D. of 12 zebrafish embryos for each treatment. * p < 0.05, ** p < 0.01, *** p < 0.001. |
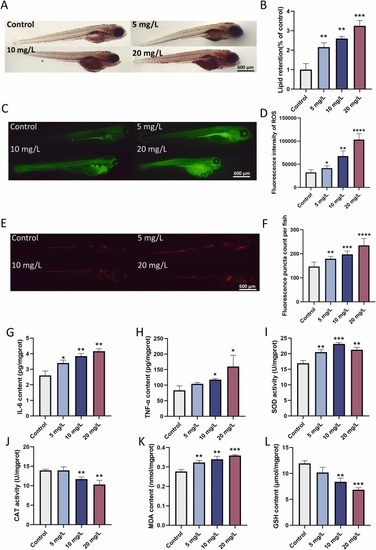
ADB-FUBINACA induces lipid dyshomeostasis (A–B), inflammation (E–H) and oxidative stress (C–D, I–L) in zebrafish embryos. (A) Representative images after continued exposure to 5–20 mg/L of ADB-FUBINACA. (B) Relative retention of yolk lipid. (C) Representative images of fluorescence distribution of ROS in embryos. (D) Relative ROS fluorescence intensity. (E) Representative fluorescence images of Tg (lyz: DsRed) of transgenic zebrafish. (F) Fluorescence puncta count per fish. (G) Content of IL-6. (G) Content of TNF-α. (I) SOD activities. (J) CAT activities. (K) Content of MDA. (L) Content of GSH. The data were presented as mean ± S.D. of three independent experiments (n = 30). * p < 0.05, ** p < 0.01, *** p < 0.001, **** p < 0.0001. |
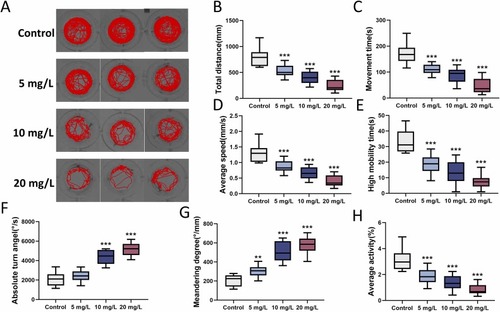
ADB-FUBINACA exposure causes locomotor injury in zebrafish larvae. (A) Movement trajectories of zebrafish larvae. (B) Total distance. (C) Movement time. (D) Average speed. (E) High mobility time. (F) Absolute turn angel. (G) Meandering degree. (H) Average activity. The data were presented as mean ± S.D. of 12 zebrafish larvae for each treatment. * p < 0.05, ** p < 0.01, *** p < 0.001. |
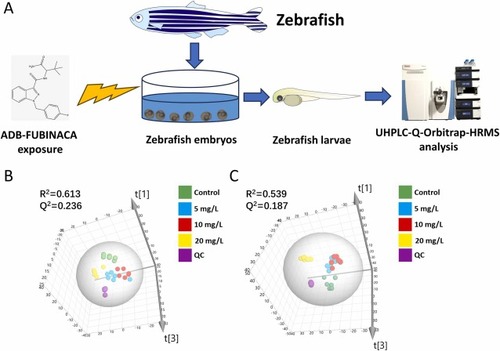
ADB-FUBINACA exposure causes metabolic disorders in zebrafish. (A) Flow chart of the ADB-FUBINACA exposure experiment. (B) 3D PCA score plot in negative mode. (C) 3D PCA score plot in positive mode. In the PCA model. In the 3D PCA model, different colors were used to represent the different groups: green for the control group, blue for the 5 mg/L of ADB-treated group, red for the 10 mg/L of ADB-treated group, yellow for the 20 mg/L of ADB-treated, and purple for the QC group. |
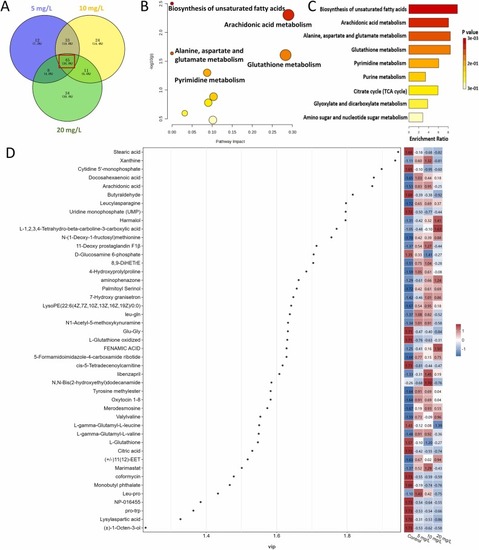
Metabolic pathways by enrichment of differential metabolites. (A) Venn diagram of differential metabolites after ADB-FUBINACA exposure. (B and C) Pathway analyses using MetaboAnalyst 6.0. (D) Dotrod heatmap of differentially expressed metabolites. |
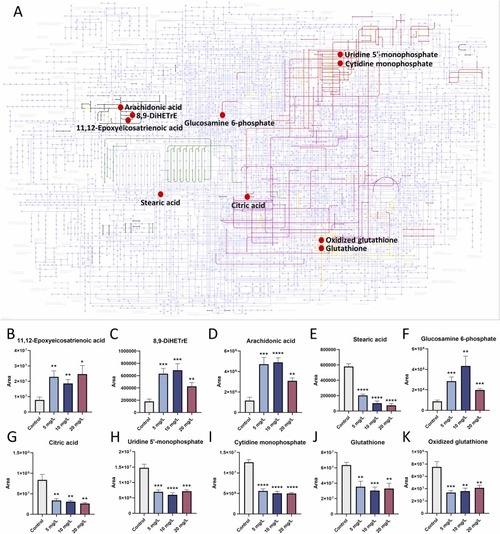
Global pathway network and key differential metabolites analysis by MetaboAnalyst 6.0. (A) The global metabolic pathway network. Significant metabolites are represented by red points, biosynthesis of unsaturated fatty acids by green lines, arachidonic acid metabolism by black lines, alanine, aspartate and glutamate metabolism by purple lines, glutathione metabolism by yellow lines, and pyrimidine metabolism by red lines. (B-K) The relative detected peak area of important metabolites in the global KEGG network. The data were presented as mean ± S.D. from six replicates for each treatment (n = 30). * p < 0.05, ** p < 0.01, *** p < 0.001, **** p < 0.0001. |
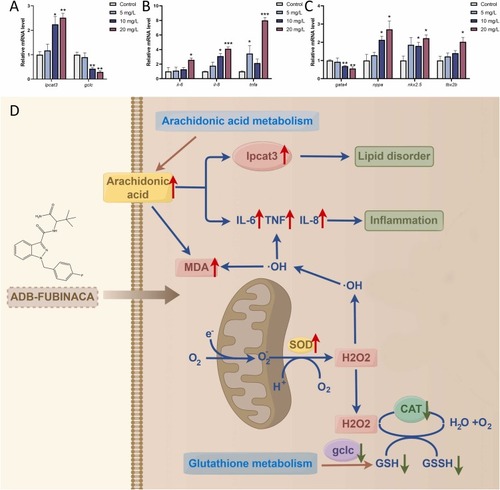
ADB-FUBINACA induced changes in the transcription levels of related genes. (A) Expression of metabolism-related genes (lpcat3 and gclc). (B) Expression of inflammation-related genes (il-6, il-8, and tnfa). (C) Expression of cardiac development-related genes (nkx2.5, nppa, gata4, and tbx2b). (D) Schematic of developmental toxicity in zebrafish embryos after ADB-FUBINACA exposure. This schematic was drawn by Figdraw (https://www.figdraw.com/). (ID: RYTIYcb092). The data were presented as mean ± S.D. of three independent experiments (n = 30). * p < 0.05, ** p < 0.01, *** p < 0.001. |